Get 40% Off
⚠ Earnings Alert! Which stocks are poised to surge?
See the stocks on our ProPicks radar. These strategies gained 19.7% year-to-date.
Unlock full list

Charts Signal Continuing Bull Market In Natural Gas

Published 04/30/2014, 12:12 AM
Updated 07/09/2023, 06:31 AM

Daily chart confirms continuation of bull trend

The monthly chart of the US Natural Gas Fund (ARCA:UNG) is a pictorial for the suffering endured by Natural Gas ETF bulls from July 2008 through mid-2012. During this time the price of UNG declined by 97%. However, there is some strong evidence that the Natural Gas market has bottomed and that a bullish cycle is upon us.
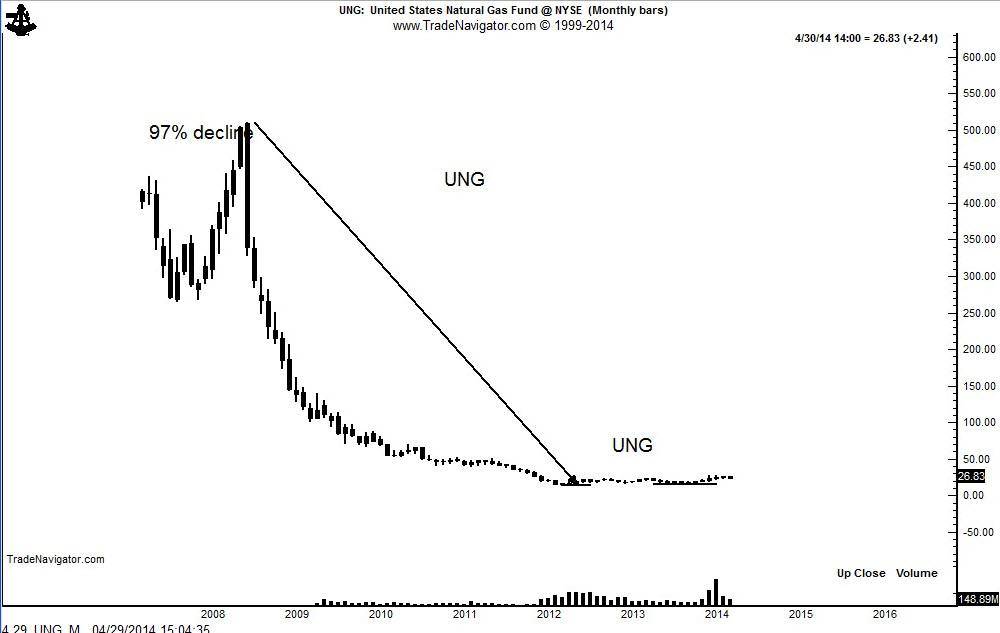
UNG Monthly

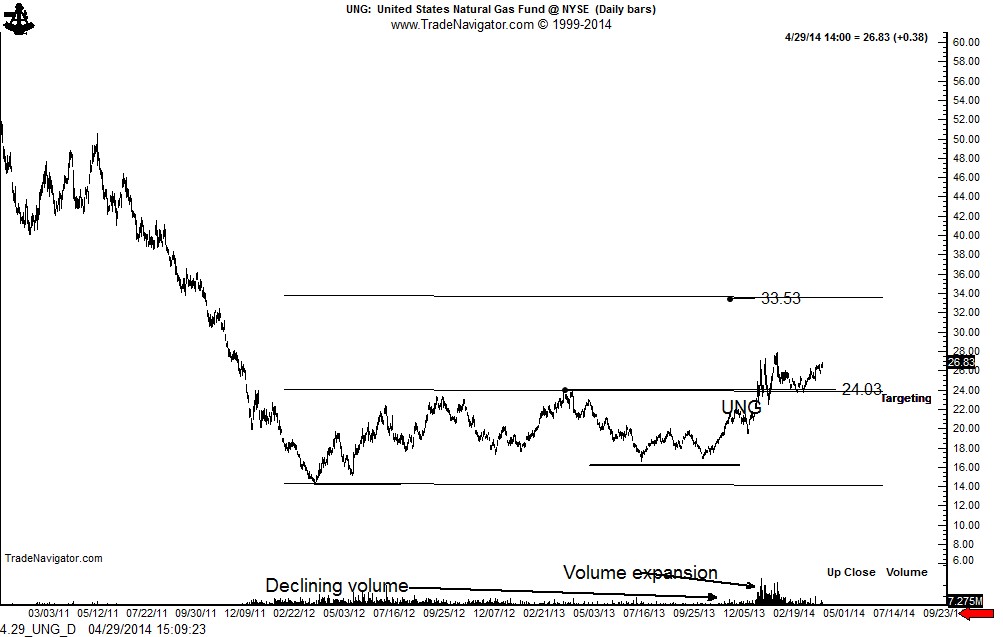
The daily chart of UNG shows that the advance in January completed a 24-month double bottom with a target of 33.50. Note the diminishing volume during the 2012 and 2013 bottoming process and the sharp expansion of volume in 2014. This is characteristic of a healthy bull trend.

UNG Daily

The 90-year chart of Nat Gas provides a broad perspective of the market. Typical of the majority of raw materials, Natural Gas has gained in value as expressed in all fiat currencies. In fact, the argument can be made in the commodity markets that long-term ownership positions are actually a short bet against paper currencies.
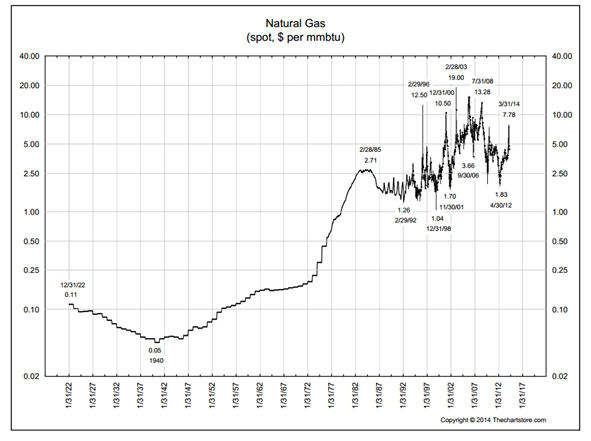
Natural Gas Price Overview 1922-Present

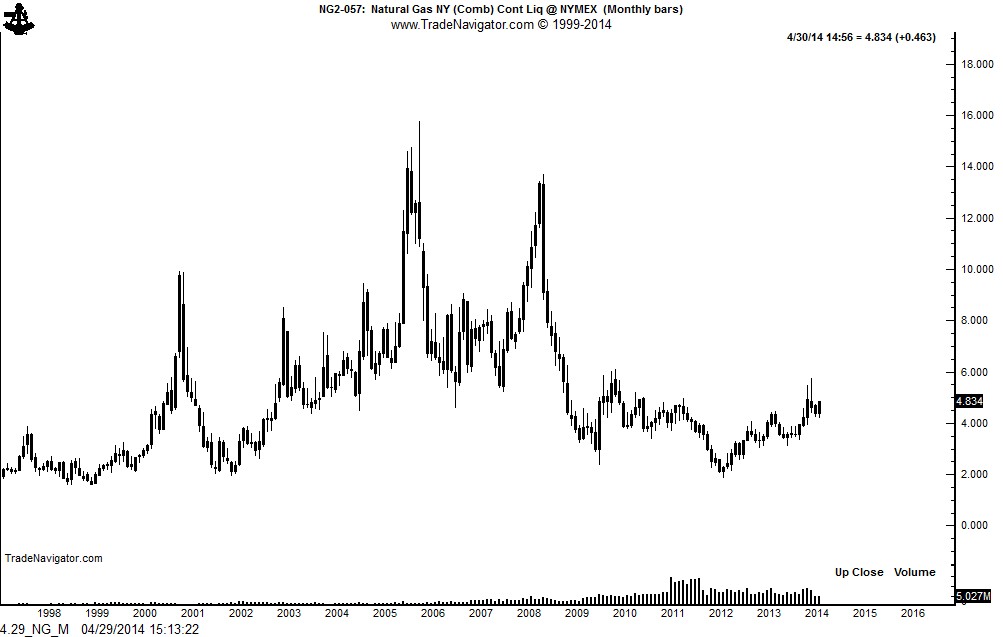
Compared to UNG (the ETF), the monthly chart of Natural Gas futures shows a similar, but much less severe, decline from the 2008 high through the 2013 low. Importantly, the inter-delivery spreads in Natural Gas have gone from more than a full-carrying structure of mid 2008 to a present price inversion whereby the near contracts carry a premium to the deferred contracts. This pricing structure is typical of raw material bull trends.

Nat Gas Futures Monthly

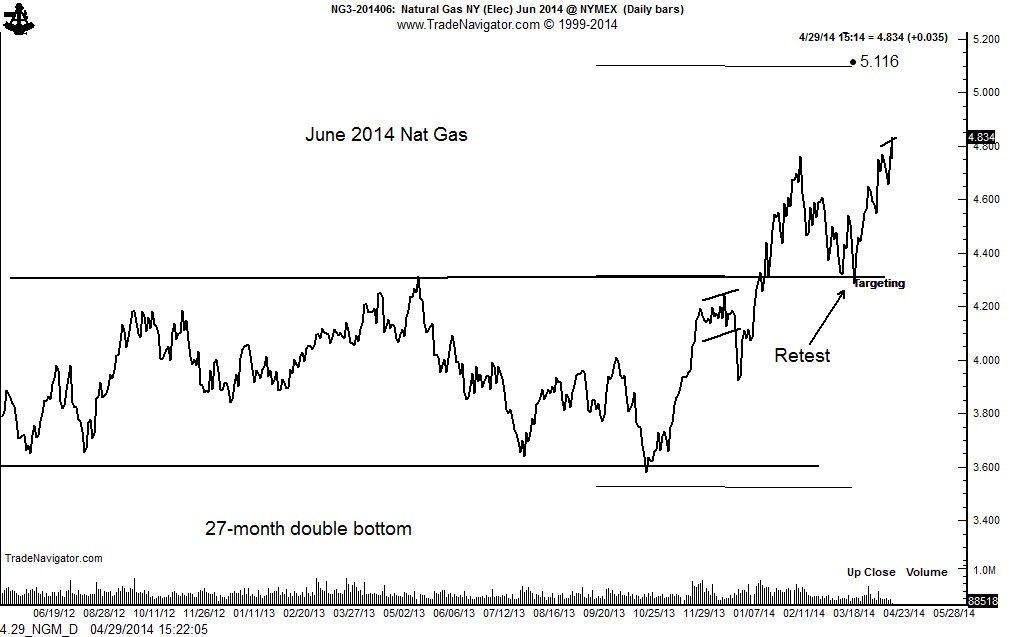
The weekly chart of the June 2014 contract displays a 27-month double bottom pattern with an initial target of 5.10. This pattern was completed in January and retested in April, as better shown on the daily closing price graph. A target of 5.10 is quite realistic given the fact that the March 2014 contract reached a high of 5.73.
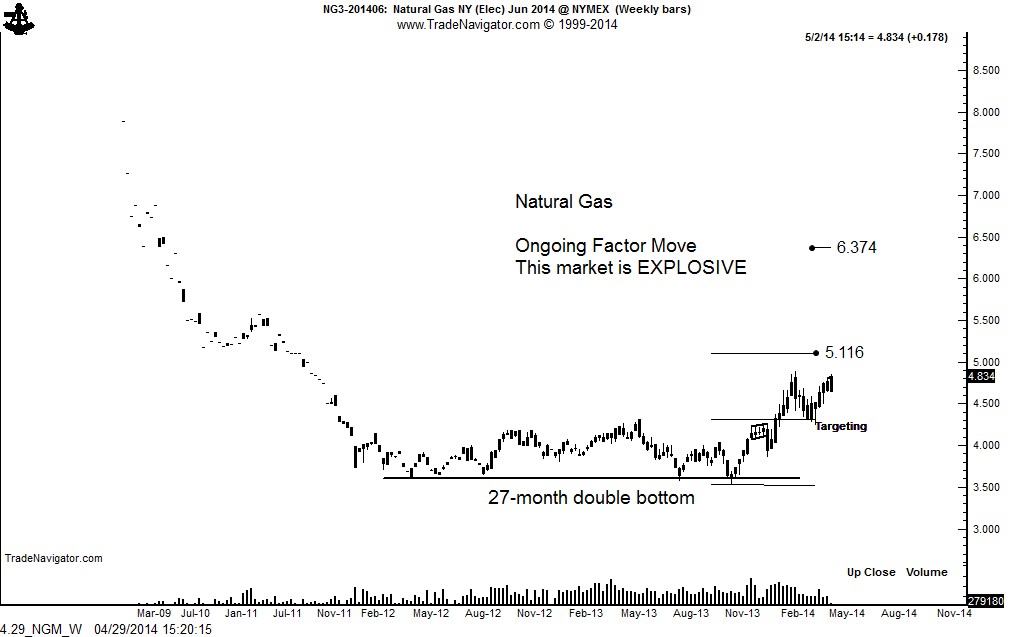
Nat Gas June 2014 Weekly

Nat Gas June 2014 Daily

I would anticipate that the Nat Gas market will work substantially higher during the next year or two, perhaps reaching the 7.00 level.

Latest comments

90 yr chart? common! its a supply and demand market
Risk Disclosure: Trading in financial instruments and/or cryptocurrencies involves high risks including the risk of losing some, or all, of your investment amount, and may not be suitable for all investors. Prices of cryptocurrencies are extremely volatile and may be affected by external factors such as financial, regulatory or political events. Trading on margin increases the financial risks.
Before deciding to trade in financial instrument or cryptocurrencies you should be fully informed of the risks and costs associated with trading the financial markets, carefully consider your investment objectives, level of experience, and risk appetite, and seek professional advice where needed.
Fusion Media would like to remind you that the data contained in this website is not necessarily real-time nor accurate. The data and prices on the website are not necessarily provided by any market or exchange, but may be provided by market makers, and so prices may not be accurate and may differ from the actual price at any given market, meaning prices are indicative and not appropriate for trading purposes. Fusion Media and any provider of the data contained in this website will not accept liability for any loss or damage as a result of your trading, or your reliance on the information contained within this website.
It is prohibited to use, store, reproduce, display, modify, transmit or distribute the data contained in this website without the explicit prior written permission of Fusion Media and/or the data provider. All intellectual property rights are reserved by the providers and/or the exchange providing the data contained in this website.
Fusion Media may be compensated by the advertisers that appear on the website, based on your interaction with the advertisements or advertisers.
© 2007-2024 - Fusion Media Limited. All Rights Reserved.