With interest rates falling most of 2014, one of the natural benefactors of cheap financing and high liquidity continue to be real estate investment trusts. Steady gains are stealthily making their way through local real estate markets as capital and labor conditions improve across the U.S. So it wouldn’t come as a surprise that REITs were one of the best performing equity indexes last year, and are already off to another a good start in 2015.
We categorize the REIT segment as part of our alternative income sleeve; and as a result of our overarching research process, we carry this sector in all three of our portfolio management disciplines. Beginning with the most conservative, the Strategic Income Portfolio has benefited greatly from our exposure to the Fidelity Real Estate Income Fund (FRIFX) with its mix of equity, preferred, and fixed income assets in the REIT space.
FRIFX also utilizes mREITs for their larger than life income streams to pay its attractive yield, while a balanced asset allocation keeps volatility to a minimum. For our Opportunistic Growth Portfolio, we opted for the low cost Vanguard Real Estate Index ETF (VNQ). Since it’s one of the easiest and cheapest way to gain exposure to an all equity REIT portfolio, VNQ has fit the bill perfectly in for clients focused on growth that don’t mind the added volatility.
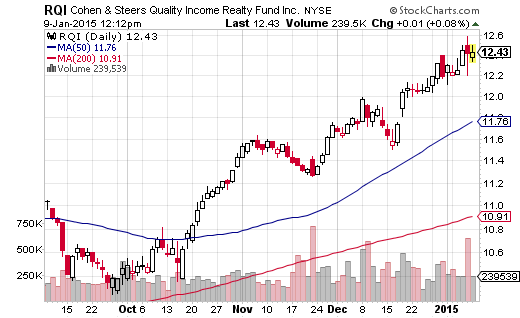
Finally, the most aggressive REIT exposure we own is for clients in our Dynamic CEF Income portfolio where we have selected the Cohen and Steers Quality Income Realty Fund (RQI). The more salient features of RQI include its 25% leverage ratio, an asset allocation of roughly 85% REIT equities and 15% REIT preferred issues, and a distribution yield of over 6%. Furthermore, RQI’s NAV closed out 2014 with a gain of 36.73%, while its market price did slightly better with a return of 37.58%.
Both returns bested their CEF category averages and using a back of the napkin calculation and comparison of RQI and VNQ, with leverage factored out, the team at Cohen and Steers were able to marginally overcome their index counterparts. We also appreciate RQI’s hefty $2 billion size, which offers us added liquidity when we feel the need to allocate away from this position.

Examining the REIT complex today, it’s clear that this sector has come quite a long way in terms of price appreciation. While that doesn’t mean a correction is imminent, we are currently flying the caution flag for new investments. Looking at the price of RQI in relation to its NAV, we are below the trailing twelve month average, which bodes well from an individual fund value perspective. However, we recommend you add RQI to your watch list and look to buy during any weakness in the first half of the year. Just be mindful that if interest rates begin to show signs of rising in 2015, it will put downward pressure on the price of REITs.
