Get 40% Off
🚨 Volatile Markets? Find Hidden Gems for Serious OutperformanceFind Stocks Now

Can Solar Bounce?

Published 08/14/2015, 11:05 AM
Updated 07/09/2023, 06:31 AM

As the energy space as a whole has taken quiet a beating this year solar has been no exception. I try to not get caught up in the debate over the implications of the drop in oil prices prices impact on the solar market and whether the demand drops as crude becomes cheaper. My focus is, as always, price action.

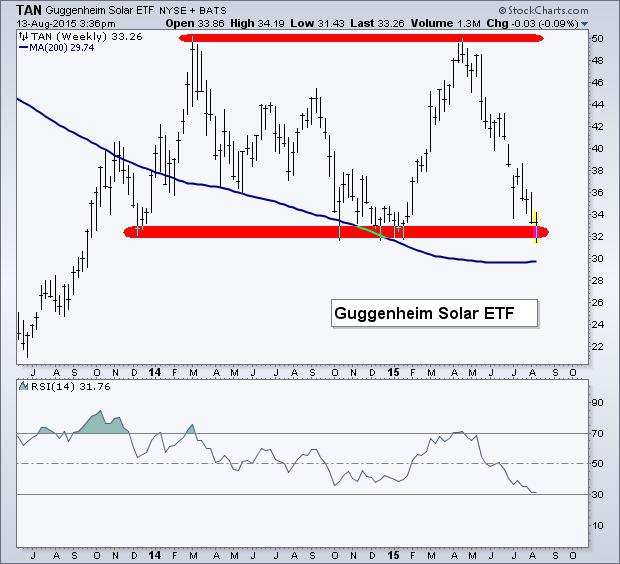
When looking at the Guggenheim Solar (NYSE:TAN), price is currently testing a level that has acted as support over the last several years. Price has found buyers at $32 during the last couple of touches at this level, will price react the same this time as well?

I’ve highlighted the support around $32 for TAN in the chart below as well as the double top that took place earlier this year at $50. What I also find interesting is the 200-week Moving Average. While it has declined over the last two years it’s has also provided a degree of support to price when the two have come in contact. The 200-week MA is just below our price support level and is also beginning to level off and rise higher.

Turning Focus To Momentum

The Relative Strength Index (RSI), as shown in the bottom panel of the chart, is very close to reaching a ‘oversold’ reading which could draw some buyers in looking for a mean-reversion. If we were to look at the daily chart of Guggenheim Solar we would see signs of a bullish divergence being created between the RSI indicator and price. This is accomplished by momentum putting in higher lows while price creates lower lows – a positive sign for a potential bullish price reversal.
3rd party Ad. Not an offer or recommendation by Investing.com. See disclosure here or remove ads .

Guggenheim Solar

Disclaimer: Do not construe anything written in this post or this blog in its entirety as a recommendation, research, or an offer to buy or sell any securities. Everything in this post is meant for educational and entertainment purposes only. I or my affiliates may hold positions in securities mentioned in the blog. Please see my Disclosure page for full disclaimer.

Latest comments

Risk Disclosure: Trading in financial instruments and/or cryptocurrencies involves high risks including the risk of losing some, or all, of your investment amount, and may not be suitable for all investors. Prices of cryptocurrencies are extremely volatile and may be affected by external factors such as financial, regulatory or political events. Trading on margin increases the financial risks.
Before deciding to trade in financial instrument or cryptocurrencies you should be fully informed of the risks and costs associated with trading the financial markets, carefully consider your investment objectives, level of experience, and risk appetite, and seek professional advice where needed.
Fusion Media would like to remind you that the data contained in this website is not necessarily real-time nor accurate. The data and prices on the website are not necessarily provided by any market or exchange, but may be provided by market makers, and so prices may not be accurate and may differ from the actual price at any given market, meaning prices are indicative and not appropriate for trading purposes. Fusion Media and any provider of the data contained in this website will not accept liability for any loss or damage as a result of your trading, or your reliance on the information contained within this website.
It is prohibited to use, store, reproduce, display, modify, transmit or distribute the data contained in this website without the explicit prior written permission of Fusion Media and/or the data provider. All intellectual property rights are reserved by the providers and/or the exchange providing the data contained in this website.
Fusion Media may be compensated by the advertisers that appear on the website, based on your interaction with the advertisements or advertisers.
© 2007-2024 - Fusion Media Limited. All Rights Reserved.