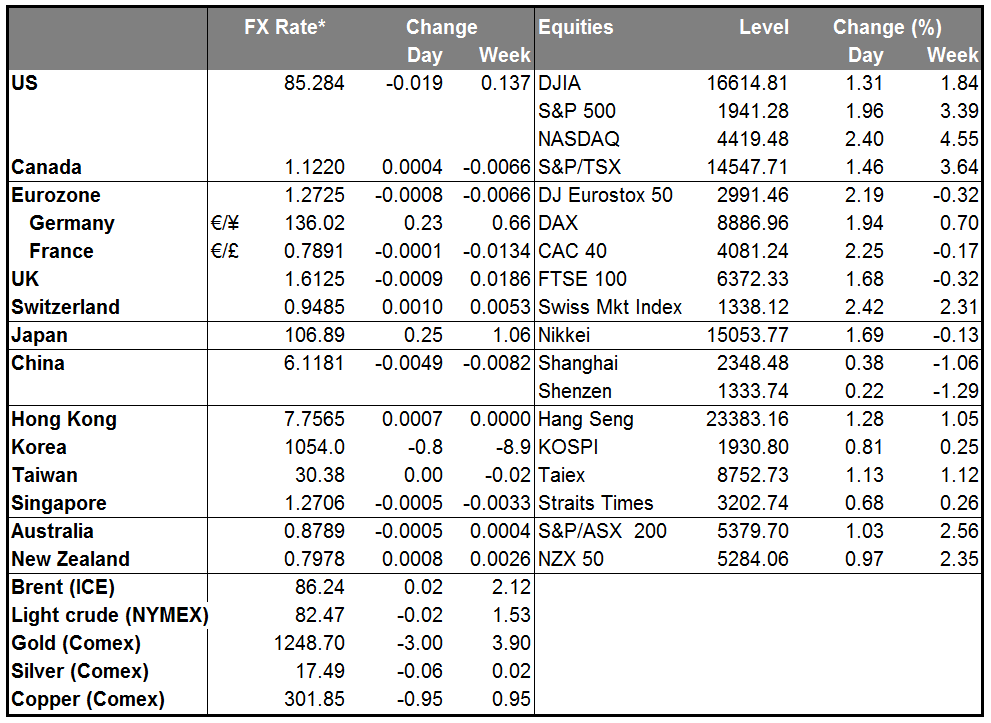
ECB to move closer to QE: EUR/USD plunged during the European trading session Tuesday on a newswire report that the ECB may expand its stimulus program in December to include the purchase of corporate bonds. This would more than double the assets that the ECB could buy, as there are some EUR 1.5tn in high-quality corporate bonds outstanding, excluding those issued by financial institutions. This compares with some EUR 1tn in eligible asset-backed securities (ABS) and covered bonds. The addition of corporate bonds could allow ECB President Draghi to achieve his goal of returning the ECB’s balance sheet to its early-2012 level (approximately EUR 1tn more than it is now) while circumventing the legal objections to buying sovereign bonds. The news is thus significantly EUR-negative in that the ECB will be expanding the supply of euros just as the Fed is ending its QE program and embarking on a tightening cycle. The divergence in monetary policy is alive and well.
US existing home sales surged in September to their highest level in a year, indicating that the housing sector activity is getting back on track. The rise in the figure was in line with data last week showing an increase in housing starts and building permits for September. The robust data show that housing market has regained its strength after a stalled activity in the summer. US 10-year yields edged up marginally (2 bps) and Fed funds rate expectations were unchanged, but the stock market came roaring back and the S & P 500 was up 2%.
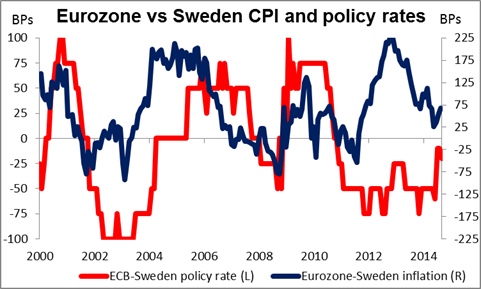
The reports about the ECB, coupled with yet another strong US indicator, sent the dollar up against almost all its G10 counterparts. SEK was the weakest, perhaps looking forward to next week’s Riksbank meeting. If the ECB is loosening, it will be hard for the Riksbank even to maintain a neutral stance as the country is already in deflation. As the graph shows, historically when the Eurozone’s inflation rate has been higher than Sweden’s, normally the Eurozone’s policy rate has also been higher. That isn’t the case now, so Riksbank may have to cut further.
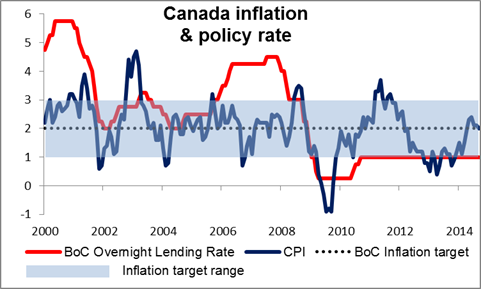
On the other hand, CAD was the only G10 currency to gain against USD as the government forecast a budget surplus of CAD 3.6bn for the current fiscal year, rising to as much as CAD 11.3bn in FY 2019-20. It’s hard to think of many other governments that run a budget surplus. The Budget Officer also revised up his forecast for GDP to 2.3% from 2.1% and said that the Bank of Canada would keep its policy rate unchanged until 2Q 2015. If we assume that the first change would be a hike – something not spelled out – his forecast is more hawkish than the market, which is discounting that rates will remain unchanged for all of 2015 (the odds of a cut in rates next year are pretty much the same as the odds of a hike). That may have been another reason for CAD strength yesterday. We may get further clarification on this point after today’s Bank of Canada meeting. At their last meeting, the Bank extended the country’s interest rate pause another time and remained neutral. We expect that they will repeat themselves and remain on hold. Although widely expected, this result could prove negative for CAD.
Australia’s Q3 CPI eased in pace on both a headline and trimmed mean basis. AUD/USD immediately plunged but recovered almost as quickly and resumed its uptrend. The pair remains below its level of yesterday morning, however, and I remain bearish towards it. On top of the slowing Chinese economy, the fact that inflation is slowing should also prove AUD negative, in my view.
Today’s indicators: During the European day, the Bank of England releases the minutes of its October policy meeting. The recent data for the UK suggests that the country’s recovery is petering out, and this has pushed off market timing for the first hike. The minutes should reveal the Bank’s stance on the recent weak inflation data as well as what the members think about the spare capacity in the labor market given the fall in the unemployment rate. It will be interesting to see if there were any more dissenting voters or on the contrary if the two dissenters changed their stance given the poor data.
In the US, the CPI for September is forecast to decline in pace, adding to concerns about whether the Fed is on track to meet its inflation target.
ECB Governing council member Luis Maria Linde and BoE MPC member Martin Weale are scheduled to speak.
The Market
EUR/USD tumbles
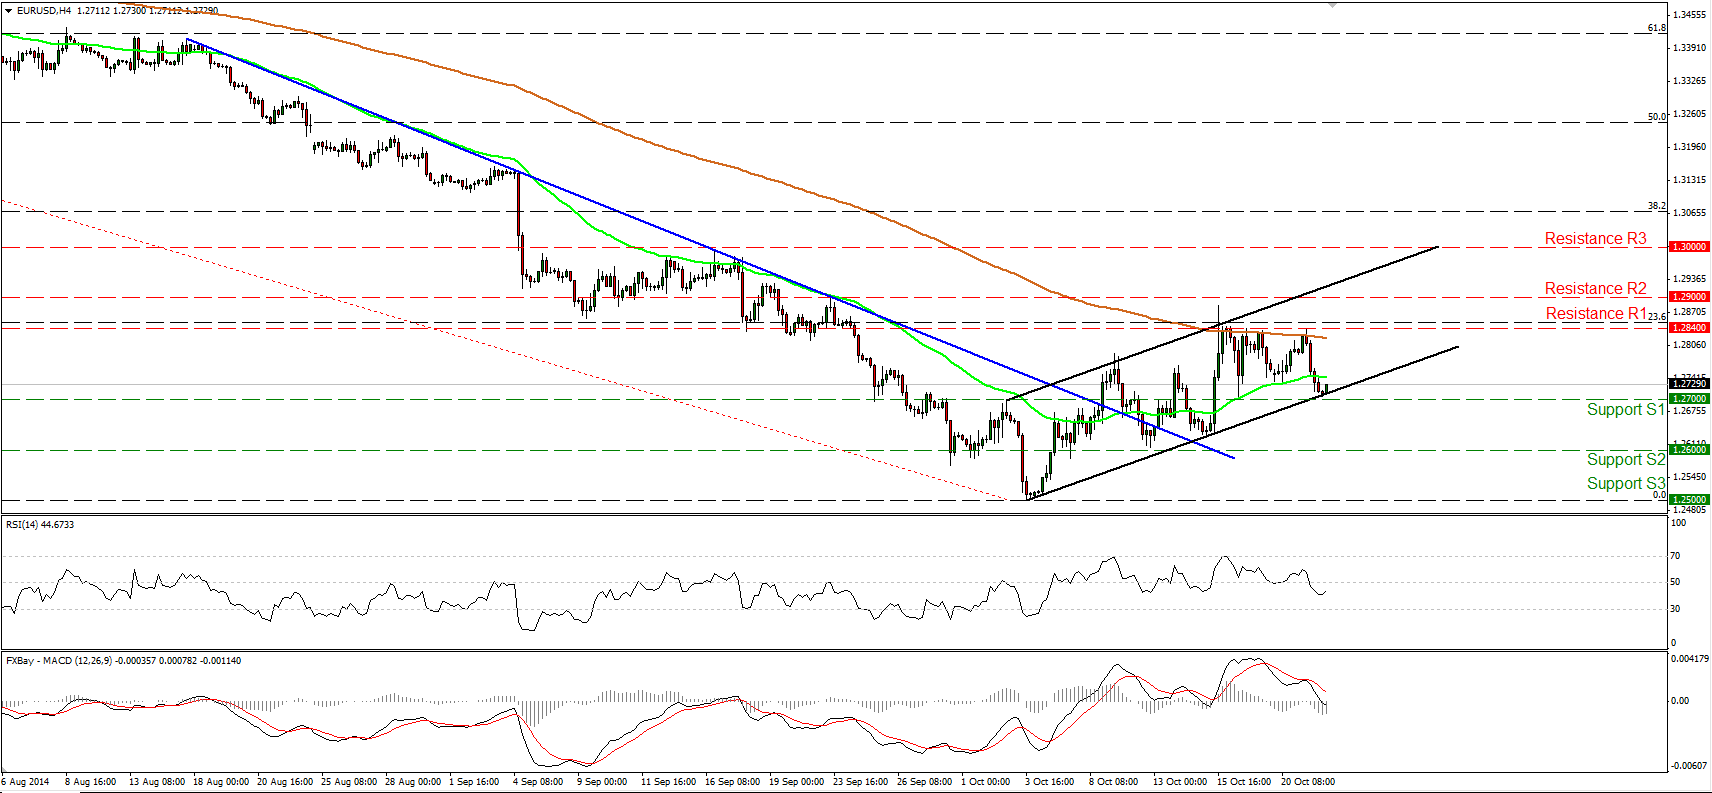
EUR/USD tumbled on Tuesday after Reuters reported that the ECB is likely to start purchasing corporate bonds as a new stimulus measure to boost inflation in the bloc. However, the decline was halted by the lower boundary of the black short-term upside channel, slightly above the 1.2700 (S1) support line. Today, the US CPI for September is due out and the forecast is for the rate to have declined. This could cause the longs to take advantage yesterday's down move and push the rate up for another test at the 1.2840 (R1) zone, near the 200-period moving average and the 23.6% retracement level of the 8th of May - 3rd of October downtrend. In the bigger picture, the price structure on the daily chart still suggests a downtrend, hence I maintain the view that the recovery from 1.2500 (S3) or any extensions of it are a corrective phase of the longer-term down path.
• Support: 1.2700 (S1), 1.2600 (S2), 1.2500 (S3).
• Resistance: 1.2840 (R1), 1.2900 (R2), 1.3000 (R3).
USD/JPY rebounds from 106.25
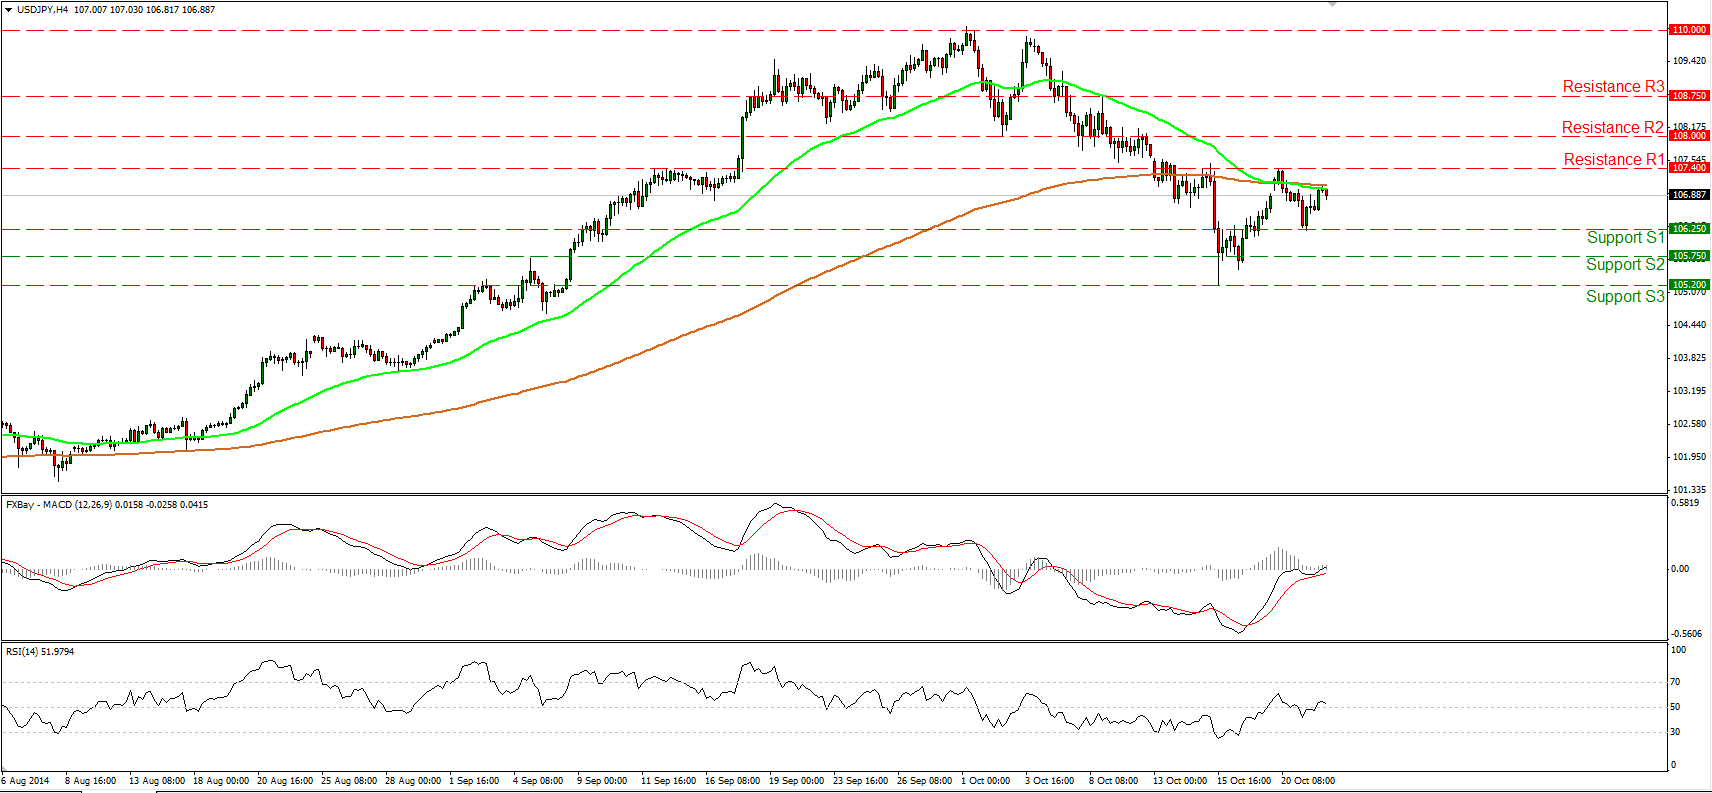
USD/JPY rebounded from 106.25 (S1) but remained capped by both the 50- and the 200-period moving averages. The rebound from 106.25 (S1) printed a higher low on the 4-hour chart, but only a move above 107.40 (R1) would signal a forthcoming higher high and flip the short-term outlook positive. As a result, I would like to adopt a "wait and see" approach for now and wait for more actionable signs before reconsidering my analysis. Both our near-term momentum studies support the mixed technical picture. The RSI, although above 50, has turned down, while the MACD turned positive and is pointing up.
• Support: 106.25 (S1), 105.75 (S2), 105.20 (S3).
• Resistance: 107.40 (R1), 108.00 (R2), 108.75 (R3).
GBP/USD finds support at 1.6100
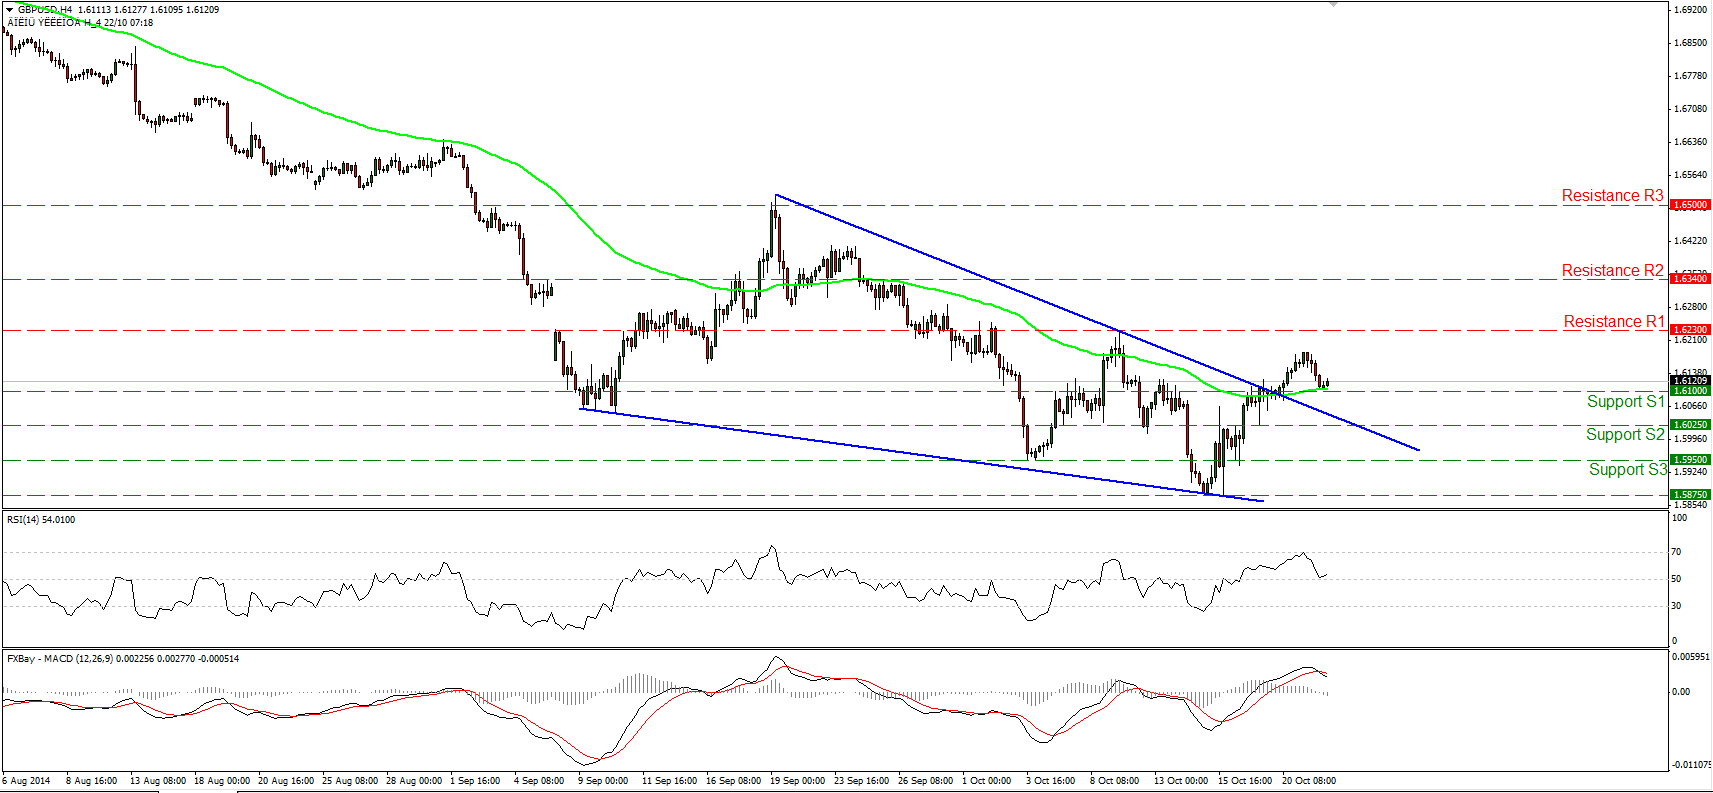
GBP/USD declined on Tuesday but found support near the 1.6100 (S1) line and the 50-period moving average. A strong rebound from there would confirm a higher low and could target the resistance hurdle of 1.6230 (R1). As long as the rate remains above the upper boundary of the falling wedge formation, the short-term bias is mildly positive in my view. This is also supported by our daily momentum indicators. I still see positive divergence between the price action and both of the studies. Moreover, after rebounding from its 30 line, the 14 day RSI reached its 50 line, while the daily MACD, although negative, lies above its trigger and is pointing up. However, much of today's movement will depend on the outcome of the minutes from the latest BoE policy meeting. As for the broader trend, I will retain the view that as long as Cable remains below the 80-day exponential moving average, the overall trend remains to the downside and I would treat any possible future advances as a retracement.
• Support: 1.6100 (S1), 1.6025 (S2), 1.5950 (S3).
• Resistance: 1.6230 (R1), 1.6340 (R2), 1.6500 (R3).
Gold finds resistance at 1255
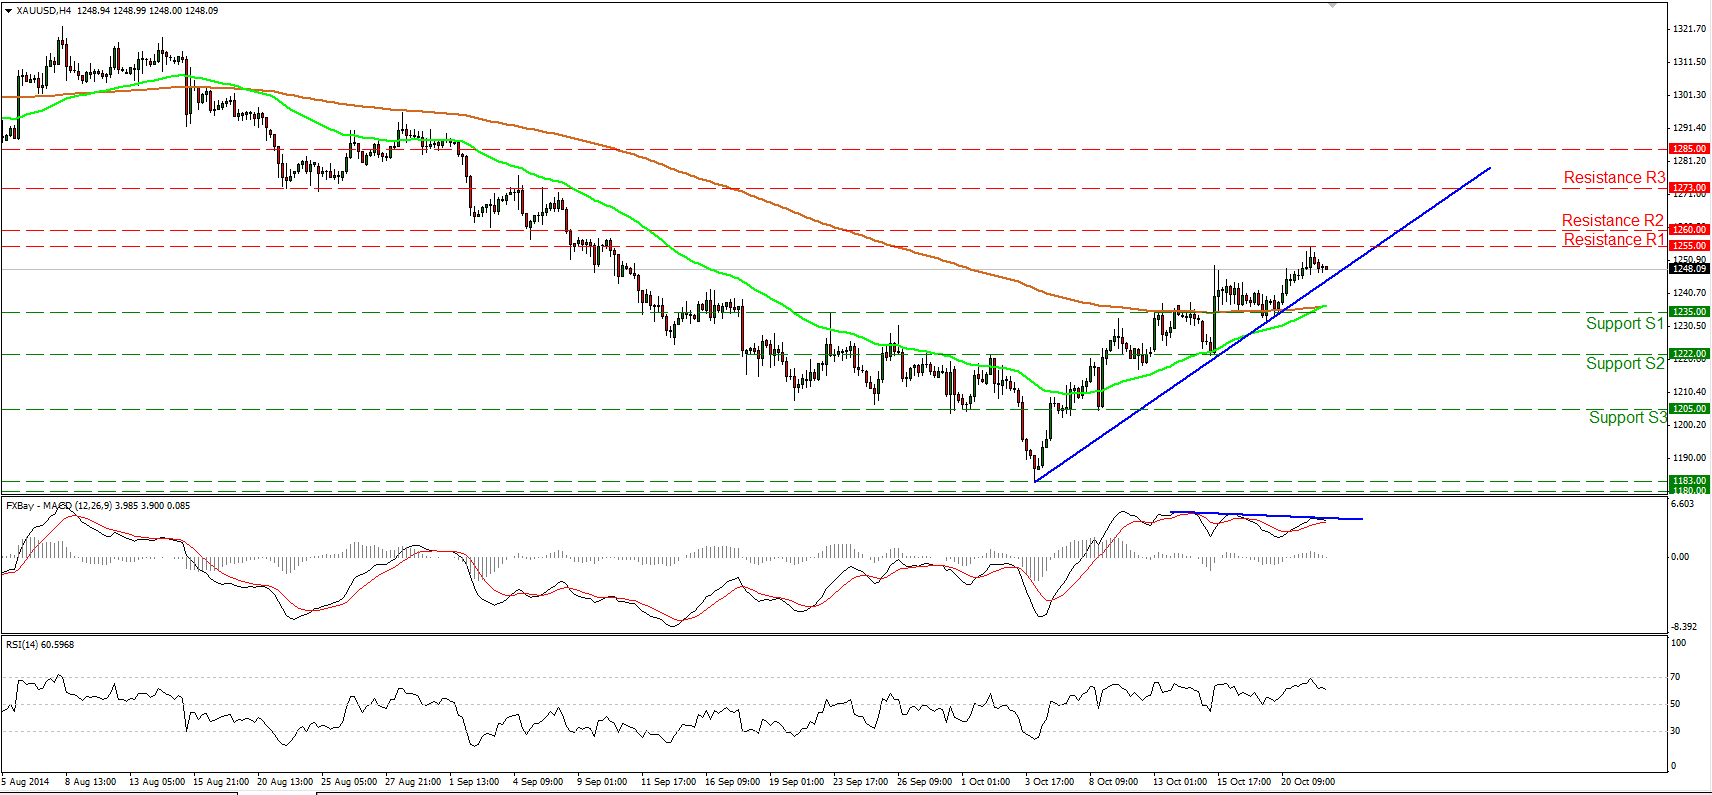
Gold moved higher yesterday, breaking above the 1250 line, but it failed to reach the 1260 (R2) barrier and found resistance at 1255 (R1). The price structure remains higher highs and higher lows above the blue uptrend line and this keeps the short-term uptrend intact. Nevertheless, I see negative divergence between the MACD and the price action, indicating decelerating bullish momentum. Moreover, the MACD appears ready to cross below its trigger line, while the RSI hit its 70 line and moved lower. These momentum signs give me enough reasons to stay aside for now and wait for both momentum and price structure to confirm each other.
• Support: 1235 (S1), 1222 (S2), 1205 (S3).
• Resistance: 1255 (R1), 1260 (R2), 1273 (R3).
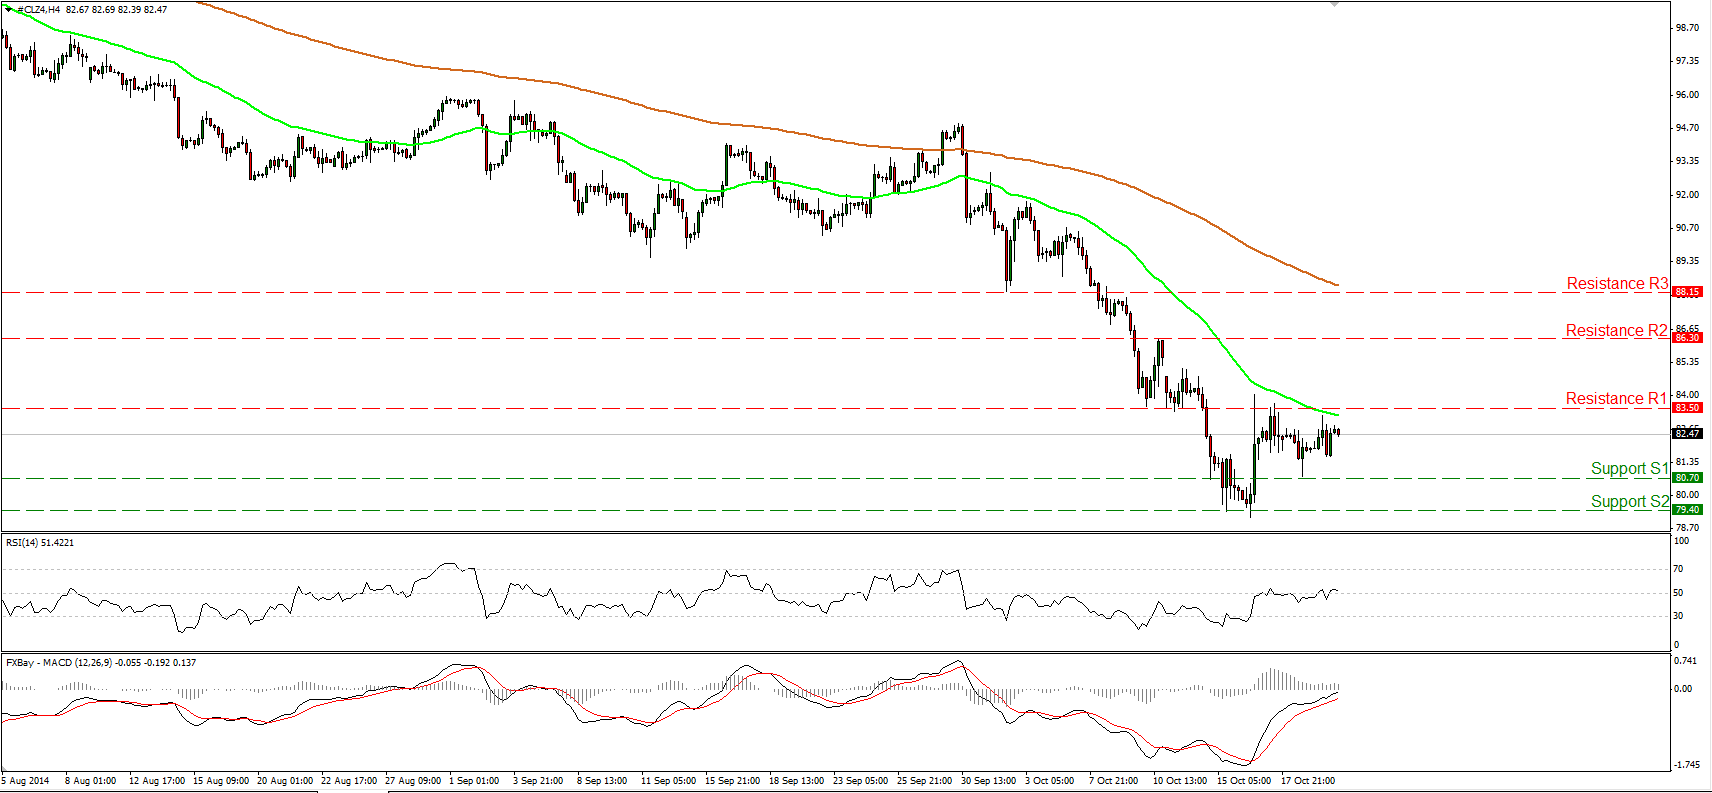
WTI stays below the 50-period EMA
WTI moved in a quiet mode yesterday remaining below the 50-period moving average and the resistance line of 83.50 (R1). As a result I would prefer to keep my flat stance. A move above that line would confirm a forthcoming higher high on the 4-hour chart and turn the short-term bias to the upside. Such a move is likely to set the stage for extensions towards the next resistance obstacle of 86.30 (R2). On the other hand, I would like to see a decisive dip below 79.40 (S2) before getting confident on the downside. In the bigger picture, the price structure on the daily chart still suggests a downtrend, thus I would treat any future up legs as a corrective phase, at least for now.
• Support: 80.70 (S1), 79.40 (S2), 79.00 (S3).
• Resistance: 83.50 (R1), 86.30 (R2), 88.15 (R3).

