Forex News and Events
Sell CAD (by Peter Rosenstreich)
Yesterday’s Bank of Canada meeting was interpreted as slightly less dovish than expected, providing CAD with a solid boost. The BoC held rates at 0.5% as widely expected and downgraded its short-term economic outlook as wildfires have forced the shutdown of several oil sand projects. The central bank’s preliminary assessment indicating that fires will chop 1.25% off the real GDP (considering the overall weak data) is likely to send the Q2 growth forecast into negative territory. However, logically the bank views the disruption as more of a temporary set-back, and so a full outlook for the economy and inflation will be provided in its next monetary policy report on 13th July.
The markets jumped on the statement with policy makers indicating that growth would rebound in Q3 as “oil production resumes and reconstruction begins.” In addition, the bank highlighted the housing market stating that “strong regional divergences,” and “household vulnerable” have grown. In our view the statement was dovish with removal of any reference to stronger exports and the “uneven” structural adjustment to the oil shock. We suspect that economic weakness will continue as the recent recovery in oil prices moderates and global headwinds expose Canadian commodity dependence weakness.
We anticipate that CPI inflation will ease from its current level of 1.7% y/y, severely missing the BoC 2.0% target. Weak growth outlook and deflationary fears should sustain the bank’s dovish stance. Canada is significantly exposed to monetary policy divergence with the Fed. We view USD/CAD pullbacks as an opportunity to reload on USD/CAD longs.
Russia, gaining positive momentum (by Yann Quelenn)
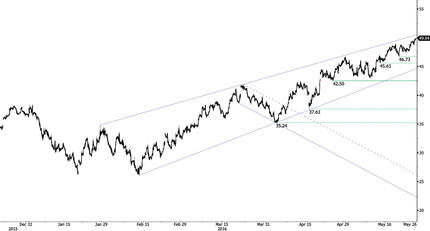
According to a recent survey of 37 economists, the Russian economy should shrink by 1% in 2016 vs. a previously expected contraction of 2%. The recent oil rebound is undoubtedly helping the country, which is heavily dependent on this commodity. A barrel of Brent is now above 50 dollars a barrel, representing a 7-month high.
The survey also indicates that inflation should remain high, around 8% y/y. Nominal wage growth has surged since the start of the year, which is adding upside pressures on consumer spending. We believe that this is a direct effect of a very weak rubble, however a newly strengthened ruble should weaken nominal wage growth. We also believe that the Russian central bank may intervene in the event of the ruble gaining too much in order to avoid damaging its GDP.
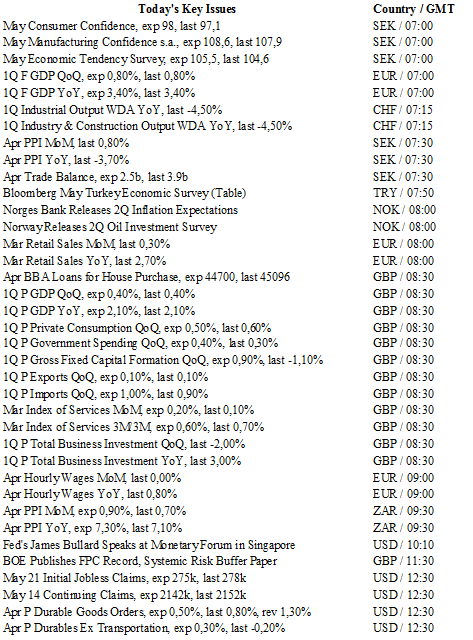
Later today, Russia will disclose its gold and forex reserves for the week ending May 20. Russia’s goal of reaching $500 million is getting closer with current reserves amounting to $390 million. Russia plans to remove the dollar, as much as possible, from its international exchanges in order to gain more credibility. This would also afford Russia a certain degree of protection against global uncertainties. 

The Risk Today
Yann Quelenn
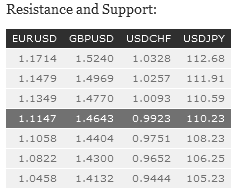
EUR/USD keeps on declining and has bounced back from former hourly support at 1.1144 (24/03/2016 low) while hourly resistance is located at 1.1227 (24/05/2016 high) and 1.1349 (17/05/2016 high). Stronger resistance lies at 1.1616 (12/04/2016 high). The technical structure suggests further downside moves within the downtrend channel. In the longer term, the technical structure favours a very long-term bearish bias as resistance at 1.1714 (24/08/2015 high) holds. The pair is trading in range since the start of 2015. Strong support is given at 1.0458 (16/03/2015 low). However, the current technical structure since last December implies a gradual increase.
GBP/USD is trading higher towards hourly resistance at 1.4770 (03/05/2016 high). Hourly support is given at 1.4404 (15/05/2016 low). Expected to show continued strengthening toward resistance at 1.4770. The long-term technical pattern is negative and favours a further decline towards key support at 1.3503 (23/01/2009 low), as long as prices remain below the resistance at 1.5340/64 (04/11/2015 low see also the 200 day moving average). However, the general oversold conditions and the recent pick-up in buying interest pave the way for a rebound.
USD/JPY is trading around 110. Selling pressures look significant around this level. The pair is trading sideways at 110.59 (20/05/2016 high) while hourly support lies at 108.72 (18/05/2016 low). Expected to show further weakening towards 108.72 as the medium term momentum is oriented downwards and the technical structure suggests a further strong bearish move. We favour a long-term bearish bias. Support at 105.23 (15/10/2014 low) is on target. A gradual rise towards the major resistance at 135.15 (01/02/2002 high) seems now less likely. Another key support can be found at 105.23 (15/10/2014 low).
USD/CHF is trading mixed after breaking symmetrical triangle. Hourly resistance can be found at 0.9938 (24/05/2016 high) while hourly support is given at 0.9883 (06/05/2016 low). Expected to show a continued bearish consolidation move. In the long-term, the pair is still trading in range since 2011 despite some turmoil when the SNB unpegged the CHF. Key support can be found 0.8986 (30/01/2015 low). The technical structure favours a long term bullish bias since last December.

