
CA Inc. (NASDAQ:CA) reported better-than-expected first-quarter fiscal 2017 results.
The company posted adjusted earnings (including stock-based compensation but excluding other one-time items) of 59 cents, which came ahead of the Zacks Consensus Estimate of 56 cents.
On a GAAP basis, earnings came in at 47 cents, flat on a year-over-year basis.
Quarter Details
CA reported revenues of $999 million, which not only increased 2.3% from the year-ago quarter but also surpassed the Zacks Consensus Estimate of $982 million. The year-over-year increase was primarily due to a 54.8% increase in Software fees and other revenues (10% of total revenue). However, Subscription and maintenance revenues (83% of total revenue) and Professional Services revenues (7%) decreased 1.2% and 2.5%, respectively.
Moreover, on a segment basis, revenues from CA’s Mainframe Solutions were down 2% on a year-over-year basis to $551 million. Revenues from Enterprise Solutions increased 10% on a year-over-year basis to $371 million, whereas Services revenues decreased 3% year over year to $77 million.
North America revenues increased 3% on a year-over-year basis, whereas International revenues were up 2% in local currency from the year-ago period. The company witnessed a 104% increase in total bookings.
Moving on, CA reported adjusted income from continuing operations before interest and income taxes (including stock-based compensation but excluding other one-time items) of $363 million, down 5.2% year over year. Non-GAAP operating income from continuing operations before interest and income taxes came in at $392 million compared with $405 million reported in the year-ago quarter.
As a percentage of revenues, adjusted income from continuing operations before interest and income taxes was down 286 basis points (bps) to 36.3%, primarily due to higher operating expenses. Adjusted operating expenses decreased 7.9% year over year to $493 million, while as a percentage of revenues, it increased 257 bps year over year to 49.4%.
CA’s adjusted net income from continuing operations (excluding amortization and other gains but including stock-based compensation) was approximately $239.5 million. On a GAAP basis, net income from continuing operations came in at $198 million.
CA exited the quarter with cash and cash equivalents of $2.776 billion compared with $2.812 billion in the previous quarter. The company’s total long-term debt (including current portion) came in at $1.946 billion. During the quarter, the company generated $161 million in cash from operating activities.
In the first quarter, CA repurchased 1.6 million shares worth $50 million. Going forward, management approved a $700 million stock repurchase program as of Jun 30, 2016. The company also paid $107 million as dividends to its shareholders during the quarter.
Fiscal 2017 Guidance
CA reiterated its fiscal 2017 guidance. The company continues to expect total revenue to be flat to up 1%, which translates to $4.03 billion to $4.07 billion. The Zacks Consensus Estimate for fiscal 2017 revenues is pegged at $4.06 billion.
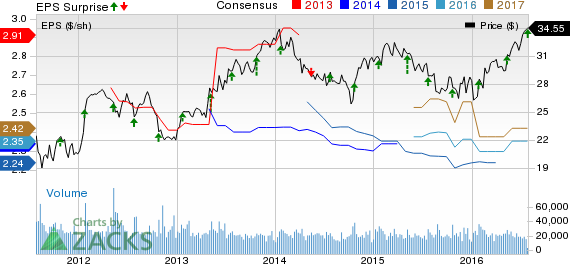
CA continues to expect non-GAAP earnings per share from continuing operations to increase in the range of 1%-3%. According to the company, “At June 30, 2016 exchange rates, this translates to reported non-GAAP diluted earnings per share from continuing operations of $2.49 to $2.54.” The Zacks Consensus Estimate for fiscal 2017 is pegged at $2.35.
The company continues to expect cash flow from operations to increase in a range of 1%–5%. Considering the exchange rates as of Jun 30, 2016, this translates to a range of $1.05 billion to $1.09 billion.
Our Take
CA reported better-than-expected first-quarter results. The year-over-year revenue comparison was also favorable. The company, also, provided an encouraging fiscal 2017 outlook.
Furthermore, we believe that the increased efficiency offered by the wide range of products will attract customers across sectors, lending stability to the business model. We are positive about CA’s increased cloud exposure. A modest cash position and regular share repurchase are also encouraging.
CA has also adopted a “go to market” sales strategy. This brings together all the commercial functions including sales, marketing, brand management, pricing and consumer insight. The integration of the marketing functions helps to lower costs, thereby improving the bottom line.
On the other hand, increasing competition from Oracle (NYSE:ORCL) , International Business Machines (NYSE:IBM) and HP Inc. (NYSE:HPQ) and exposure to Europe remain the near-term headwinds.
CA has a Zacks Rank #3 (Hold).
HP INC (HPQ): Free Stock Analysis Report
INTL BUS MACH (IBM): Free Stock Analysis Report
CA INC (CA): Get Free Report
ORACLE CORP (ORCL): Free Stock Analysis Report
Original post