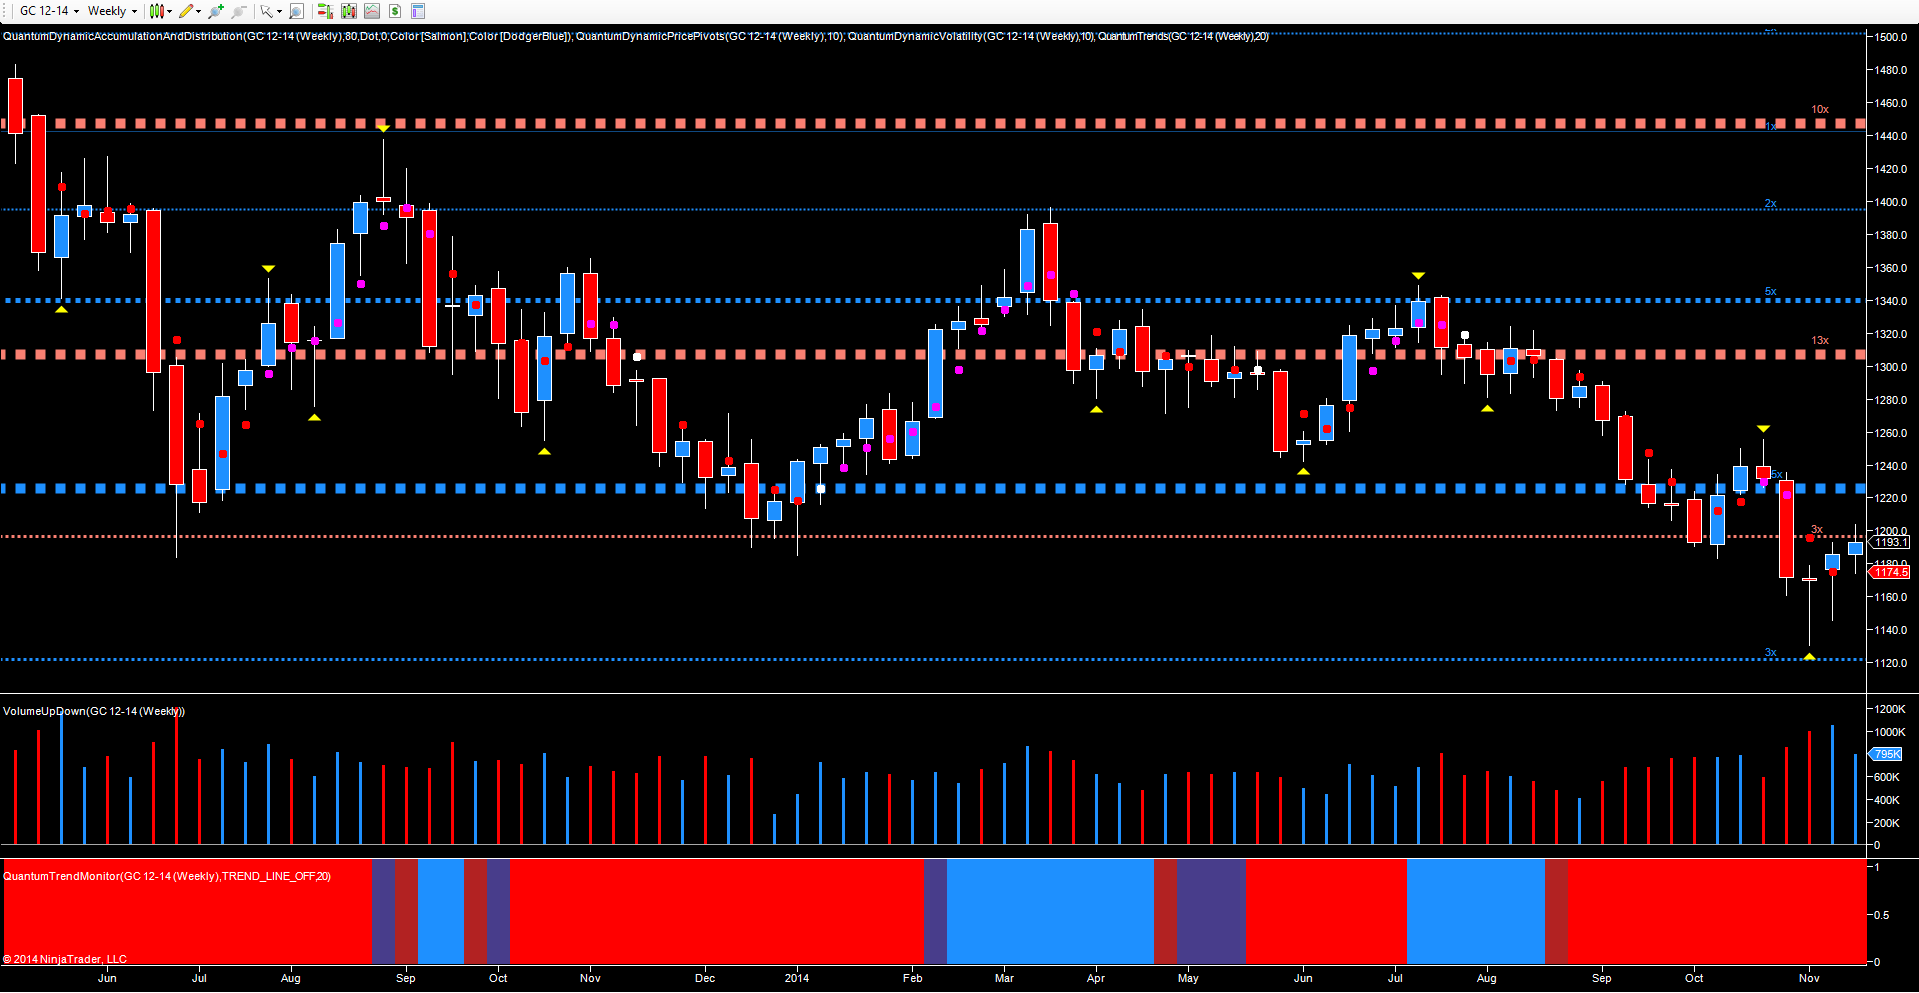
The price action for gold throughout much of November could best be described as chaotic, with volatile days of price action subsequently followed by periods of relative inactivity, only to be replaced with extreme and unpredictable swings intraday. And perhaps the place to start with any analysis for the precious metal is on the weekly chart, for a more considered view of the price action.
What is perhaps instantly clear from this chart is the modicum of buying now starting to appear at the current price level, with the initial phase of support signalled by the deep hammer candle of early November. This saw the price of gold touch a low of $1130 per ounce before recovering to end the week close to the open at $1169.80 per ounce. Volume here was high at 991K, and was duly followed with a repeat performance the following week, with gold closing higher this time, with a subsequent a hammer candle once again, and signalling further buying, with the volumes moving through the 1000 K level to end at 1051 K on the week.
This short term bullish momentum for gold has continued this week, with the metal now testing the minor resistance level in the $1197 per ounce area, but once again is struggling to move higher with any degree of conviction, and with the deep area of price resistance now waiting ahead in the $1225 per ounce area, any sustained rally will require equally sustained volumes to maintain a longer term move higher. What is more likely from the technical picture in this timeframe, is this is simply a pause point and minor rally higher, in an otherwise longer term downwards trend. This is a facet of price action we have seen several times before for gold in the last few months, and as such one minor rally does not constitute a meaningful reversal in trend.
Whilst there has undoubtedly been some buying in the market during November, clearly evident both from the price action and from the associated volumes, this falls well short of the buying volumes required to reverse the longer term bearish trend. As such, the current rally, whilst no doubt a welcome relief for gold bulls seems unlikely to last, with a resumption in the bearish trend set to return.
However, there is one caveat to this statement, and that’s Switzerland. With the referendum now only two weeks away, a yes vote on the 30th November could see even more extreme price action in the days following, with the Swiss National Bank having to buy gold in the spot market, as it is forced to increase its holding from 8% to 20%. So an interesting period for gold traders and investors ahead. However, as always, volume price analysis will draw the curtain aside to reveal the truth behind the price action.
