Get 40% Off
👀 👁 🧿 All eyes on Biogen, up +4,56% after posting earnings. Our AI picked it in March 2024.
Which stocks will surge next?
Unlock AI-picked Stocks

Buy The S&P 500 On The Death Cross In The Russell 2000

Published 09/24/2014, 12:12 AM
Updated 07/09/2023, 06:31 AM

We discussed weakness in the Russell 2000 over the weekend. Our conclusion was that relative strength or weakness in RUT in the past has been an inconsistent indicator for the broader market (post).

This is consistent with a prior post where we analyzed significant market corrections and found no reliable relationship between market tops and the relative performance of RUT and NDX (risk indices) versus the SPX and DJIA (large cap indices; post).

The chatter in the market now is that RUT is experiencing a "death cross", where its 50-dma is crossing below its 200-dma. The conventional wisdom is that this indicates weakness in trend and is therefore bearish. The contrarian point of view is that many "death crosses" coincide with good buying opportunities. So, which is it?

The evidence for the contrarians looks more compelling on first glance. The vertical lines are each death cross (lower panel) in the past 20 years. More often than not, RUT (top panel) moved higher in the months after a death cross.
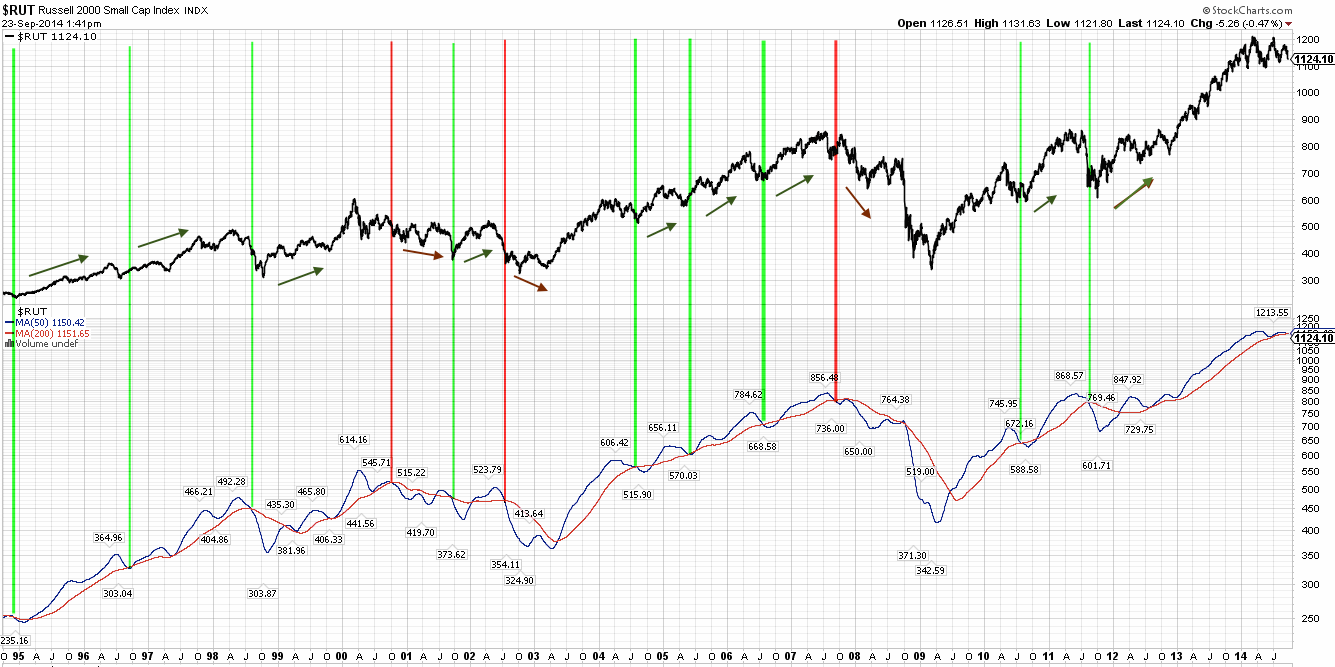
RUT Death Crosses--20 Y Overview

If you look more closely, you will notice that RUT only moved lower after death crosses in 2000-02 and 2007. These were bear markets. In other words, buying the death cross in RUT worked because the broader market was in a bull market (1995-1999; 2004-06; 2010 and on).

So, if you view the current market as remaining in bull mode over the next year, buying RUT now likely will pay off. But this analysis tells us very little about RUT itself. Investors' capital is finite: a dollar invested in one asset is an investment foregone in another asset.

The better question for investors is this: are investors better off buying RUT or SPX after a death cross?

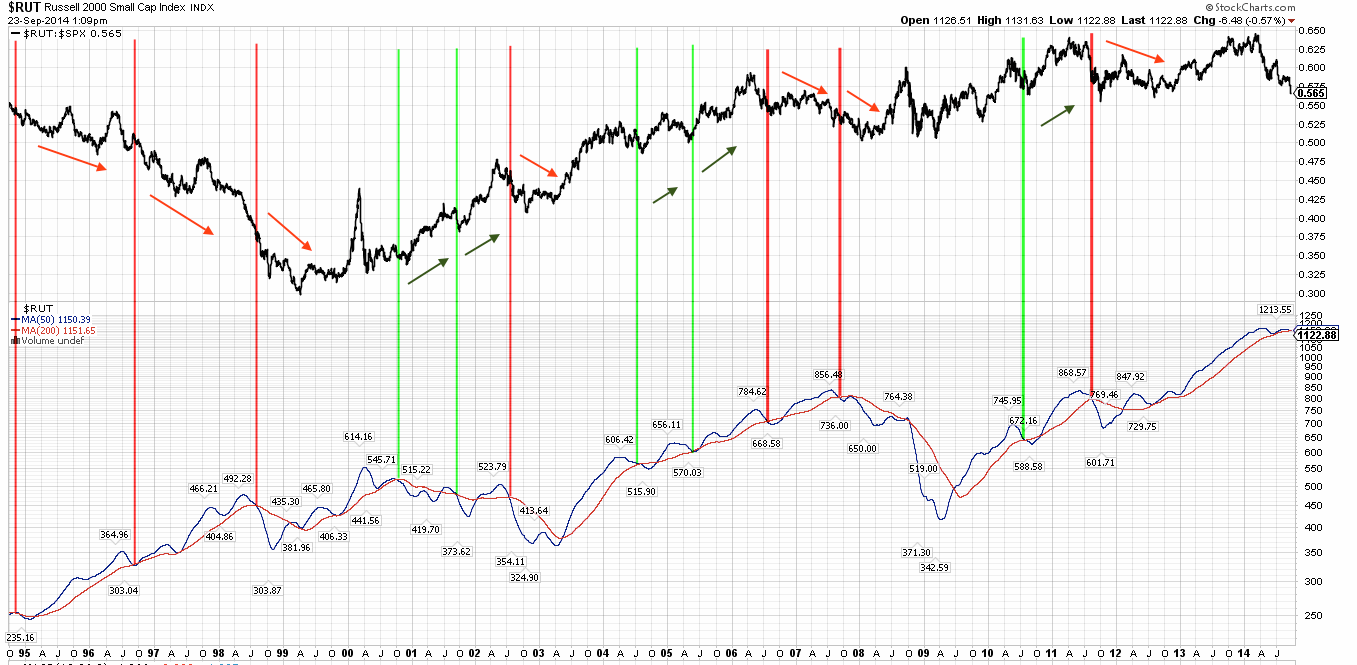
As it turns out, they are better off buying SPX. In the chart above, RUT was a buy 9 times following a death cross. In the chart below, SPX outperformed RUT in 5 of those 9 times (top panel).
3rd party Ad. Not an offer or recommendation by Investing.com. See disclosure here or remove ads .

SPX vs RUT Overview with Death Crosses

Moreover, in 2 of the 3 times the death cross led to lower prices, SPX also outperformed RUT.

The death cross in RUT by itself is an indicator with relatively little meaning. RUT doesn't consistently lead the market lower at tops; if the broader market is moving higher, so will RUT.

It's better to watch SPX than RUT. A turn lower in the moving averages for SPX holds far more significance than it does for RUT, for a simple reason: that's where the money is.
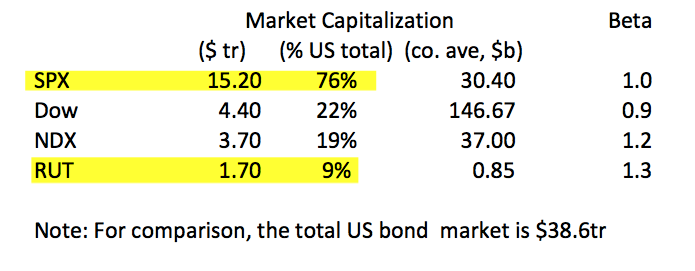
Total Market Cap, US Major Markets

Original post

Latest comments

Risk Disclosure: Trading in financial instruments and/or cryptocurrencies involves high risks including the risk of losing some, or all, of your investment amount, and may not be suitable for all investors. Prices of cryptocurrencies are extremely volatile and may be affected by external factors such as financial, regulatory or political events. Trading on margin increases the financial risks.
Before deciding to trade in financial instrument or cryptocurrencies you should be fully informed of the risks and costs associated with trading the financial markets, carefully consider your investment objectives, level of experience, and risk appetite, and seek professional advice where needed.
Fusion Media would like to remind you that the data contained in this website is not necessarily real-time nor accurate. The data and prices on the website are not necessarily provided by any market or exchange, but may be provided by market makers, and so prices may not be accurate and may differ from the actual price at any given market, meaning prices are indicative and not appropriate for trading purposes. Fusion Media and any provider of the data contained in this website will not accept liability for any loss or damage as a result of your trading, or your reliance on the information contained within this website.
It is prohibited to use, store, reproduce, display, modify, transmit or distribute the data contained in this website without the explicit prior written permission of Fusion Media and/or the data provider. All intellectual property rights are reserved by the providers and/or the exchange providing the data contained in this website.
Fusion Media may be compensated by the advertisers that appear on the website, based on your interaction with the advertisements or advertisers.
© 2007-2024 - Fusion Media Limited. All Rights Reserved.