Forex News and Events:
The quiet FX trading will likely come to an end today. The event flow starts with the Fed decision later today (18:00 GMT), the most expected Scottish referendum takes place tomorrow. Else, the ECB’s TLTRO results, the SNB and Norges Bank decisions will be closely monitored. As FX positions are mixed on the outcome of leading eco-political events, we shortly deviate from the Fed and the Scots to take a closer look into the Euro-zone’s monetary situation. Released in the morning, the UK’s labor market showed further improvement in July-August data. Post-data GBP-gains remained limited. We remain in the sidelines before we hear more clarity on the Scottish independence.
ECB’s TLTRO remain at lower bounds
The ECB’s Targeted Long-Term Refinancing Operation (TLTRO) – designed to target the non-financial sector to push the liquidity toward the real economy – seems gathering less-than-ideal responsiveness. Banks are expected to take around 100 billion euro loans tomorrow according to UBS analysts. This means that the total lending will not exceed three fourth of the maximum 400 billion euros foreseen for the first two operations. Hence, the ECB’s TLTROs remains short of the anticipated success. The scrawny interest in this non-financial lending program is expected to weigh on peripheral bonds, pushing the core-periphery spreads wider at the second part of the week.
At this point it is interesting to take a rapid glance to correlation dynamics between yield spreads and the euro strength. The 40-day correlation between the 10-year Spanish/German and the EUR/USD stepped up to 35% since September 4th (ECB additional stimulus) and stabilized above 30%. Given the significant positive correlation between EZ bond spread and the EUR/USD, wider spreads will likely give support to EUR/USD in the short-run. These dynamics might challenge ECB’s goal for a weaker euro in the short-run. Temporary recovery in EUR is seen as good opportunity to reinforce the EUR-short positions, especially versus the USD on firm divergence between the Fed and the ECB policy outlook. Moving forward, the additional ECB measures (ABS and covered bond purchases introduced on September 4th) aim to support the TLTROs, the December results will hopefully look better.
UK unemployment improves to 6.2%
The UK’s unemployment report surprised positively once again. The 3-month unemployment rate fell to 6.2% in July (vs. 6.3% exp. & 6.4% last), the claimant count rate improved to 2.9% in August as expected (vs. 3.0% a month ago). As knee-jerk reaction, GBP/USD spiked to 1.6336, EUR/GBP hit 0.79353. Comprehensibly, the GBP-bulls remained short-lived.
The GBP/USD option bids trail above 1.6300 in today’s expiry, mostly to take advantage from a potential post-Fed rally later in the day. Upside attempts however remain vulnerable. The short (and even long)-term direction will be defined as the Scottish situation gets more clarity. The latest polls show that the yes-no gap remains tight.
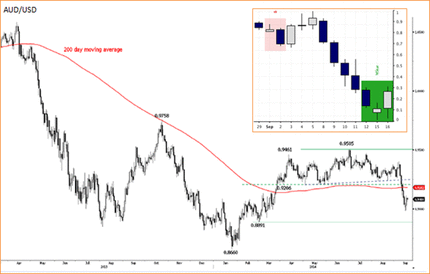
AUD/USD: Morning Star formation
There is a morning star formation on the AUD/USD daily chart. Our candle pattern monitor qualifies the formation as high conviction given the low levels over the past three sessions. The candle patterns analysis suggests a short-term bullish reversal, yet the Fed will say the last word. Key resistance is seen at 0.9182/0.9200 (200-dma & optionality).

Today's Key Issues (time in GMT):
2014-09-17T11:00:00 USD Sep 12th MBA Mortgage Applications, last -7.20%2014-09-17T12:30:00 USD Aug CPI MoM, exp 0.00%, last 0.10%
2014-09-17T12:30:00 USD Aug CPI Ex Food and Energy MoM, exp 0.20%, last 0.10%
2014-09-17T12:30:00 USD Aug CPI YoY, exp 1.90%, last 2.00%
2014-09-17T12:30:00 USD Aug CPI Ex Food and Energy YoY, exp 1.90%, last 1.90%
2014-09-17T12:30:00 USD Aug CPI Core Index SA, exp 238.597, last 238.311
2014-09-17T12:30:00 USD Aug CPI Index NSA, exp 238.26, last 238.25
2014-09-17T12:30:00 USD 2Q Current Account Balance, exp -$113.4B, last -$111.2B
2014-09-17T14:00:00 USD Sep NAHB Housing Market Index, exp 56, last 55
2014-09-17T18:00:00 USD Fed QE3 Pace, exp $15B, last $25B
2014-09-17T18:00:00 USD Fed Pace of Treasury Pur, exp $10B, last $15B
2014-09-17T18:00:00 USD Fed Pace of MBS Purchases, exp $5B, last $10B
2014-09-17T18:00:00 USD FOMC Rate Decision, exp 0.25%, last 0.25%
The Risk Today:
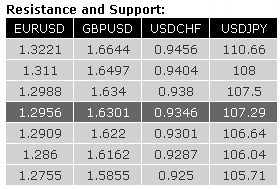
EURUSD EUR/USD is bouncing from its oversold decline. However, the hourly resistance at 1.2988 (05/09/2014 high, see also the short-term declining trendline) has held thus far. An initial support lies at 1.2909 (12/09/2014 low). A break of the hourly support at 1.2860 would signal the resumption of the underlying downtrend. Another hourly resistance can be found at 1.3110 (02/09/2014 low). In the longer term, EUR/USD is in a succession of lower highs and lower lows since May 2014. The break of the key support at 1.3105 (06/09/2013 low) opens the way for a decline towards the strong support area between 1.2755 (09/07/2013 low) and 1.2662 (13/11/2012 low). A key resistance lies at 1.3221 (28/08/2014 high).
GBPUSD GBP/USD is getting closer to its resistance at 1.6340 (05/09/2014 high), despite yesterday's break of the hourly support at 1.6186 (11/09/2014 low). Another resistance stands at 1.6497. An hourly support now lies at 1.6162 (16/09/2014 low). In the longer term, prices have collapsed after having reached 4-year highs. The break of the key support at 1.6220 confirms persistent selling pressures and opens the way for further decline towards the strong support at 1.5855 (12/11/2013 low). A key resistance now stands at 1.6644.
USDJPY USD/JPY remains well supported despite deep short-term overbought conditions. The short-term technical structure is positive as long as the support at 106.64 holds. Another hourly support can be found at 106.04. An hourly resistance now lies at 107.39 (12/09/2014 high). A long-term bullish bias is favoured as long as the key support 100.76 (04/02/2014 low) holds. The break to the upside out of the consolidation phase between 100.76 (04/02/2014 low) and 103.02 favours a resumption of the underlying bullish trend. A test of the major resistance at 110.66 (15/08/2008 high) is expected.
USDCHF USD/CHF has faded near the resistance at 0.9404 (61.8% retracement of 2013 decline). However, the short-term technical structure remains positive as long as the hourly support at 0.9287 (05/09/2014 low) holds. Another support can be found at 0.9176. From a longer term perspective, the technical structure calls for the end of the large corrective phase that started in July 2012. The break of the strong resistance at 0.9250 (07/11/2013 high) opens the way for a move towards the next strong resistance at 0.9456 (06/09/2013 high). Supports can be found at 0.9176 (03/09/2014 low) and 0.9104 (22/08/2014 low).

