- We have all heard that weakness in small caps foreshadows a breakdown in the general stock market.
- The implication is that small caps are a leading indicator, and S&P 500 weakness is coming soon.
- Historical evidence does not support either claim.
- Small caps are important and they can help us manage risk in 2014 if we know what to look for.
- It is not safe to assume that 2014 cracks in small caps can only widen.
- Small caps could rally in 2014 as they did in 2013.
- Small caps lead the S&P 500 and can assist in forecasting.
- Strong rallies in the stock market do not need the participation of small caps.
- Do small caps lead the S&P 500 or do the two indexes move in unison?
- Did any of the high-conviction, clearly risk-on periods feature a rally in the S&P 500 without the participation of small caps?
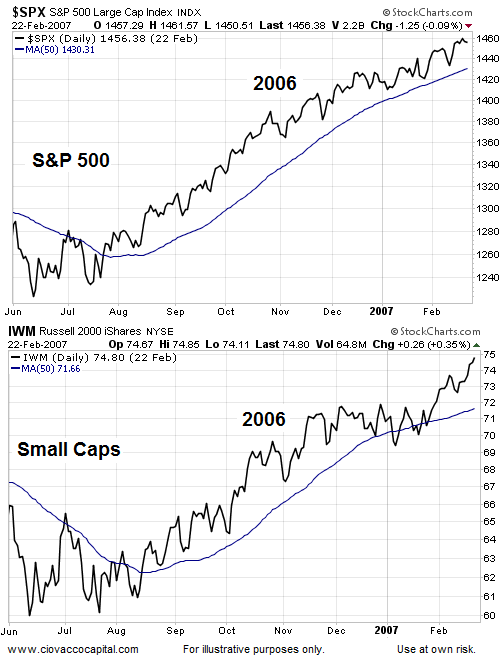
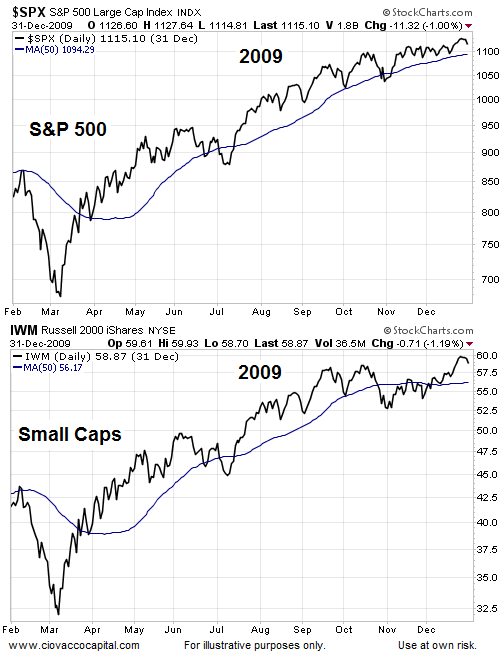
- Small caps and the S&P 500 tend to move in unison, meaning small caps had little predictive value.
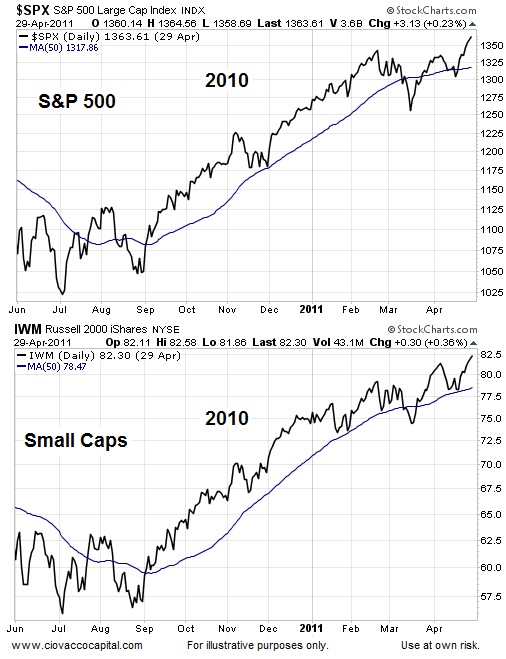
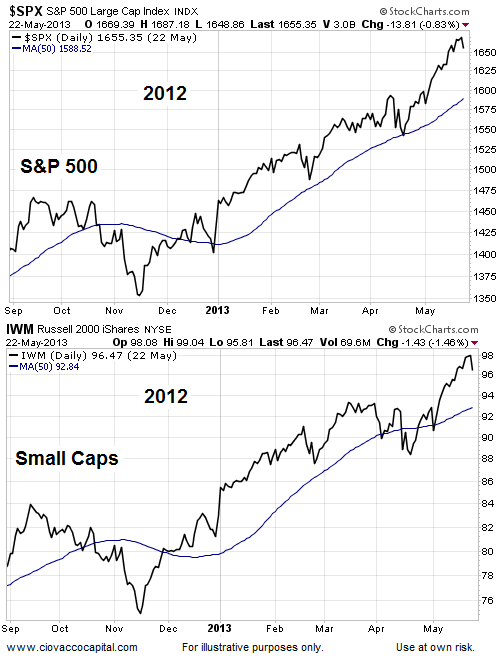
- All the strong-conviction rallies examined occurred with the help of small caps, meaning if we expect the S&P 500 to rally hard for the remainder of 2014, we need to see small caps gain some traction.
- If small caps remain weak, then the odds of a big rally in the S&P 500 are not favorable, and thus we should continue to keep a close eye on equity risk.
- If small caps rally, especially convincingly, we will become more open to a sustained rally in the broader stock market, and thus, open to increasing our exposure to stocks if prudent.
Legitimate Concerns About The Message Of Small Caps
Many, including CCM on May 16, have voiced concerns about the economic message being sent by small cap stocks in 2014. Comments similar to those shown below have been common and warranted in recent weeks. From NASDAQ.com:
The tug of war between earnings, economic data, and interest rates has helped to put a modest floor under larger, cash-rich companies. However, the same can’t be said for small cap stocks, which have been under more selling pressure recently…On the surface, this may seem like a somewhat benign decline of 9% from the 2014 highs in IWM. However, there is some legitimate concern mounting that small-cap stocks may become be a leading indicator of weakness that will spill over into the rest of the market. It would not be surprising to see this index lead a correction lower after being one of the strongest segments during this bull market.
Small Cap Cracks Always Mean Trouble, Right?
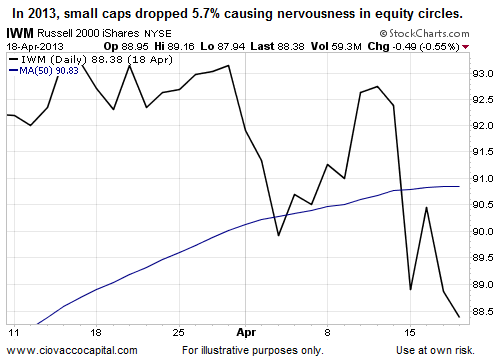
A common investment mistake we all have made is to decide in advance what the future looks like. For example, if we saw small caps begin to fall hard in early 2013, we may have decided that a correction in the S&P 500 was coming soon. The chart below shows a 5.7% drop in small caps that occurred in Q1-Q2 2013. For the answer to “what happened next?”, continue reading.
Small Cap Cracks Don’t Necessarily Have To Widen
Did small caps and the S&P 500 follow the bearish script as many expected in 2013? No. In fact small caps found their footing near point A below, and the S&P 500 rallied near point B. After point B, the S&P 500 rewarded flexible investors with an 8% pop.
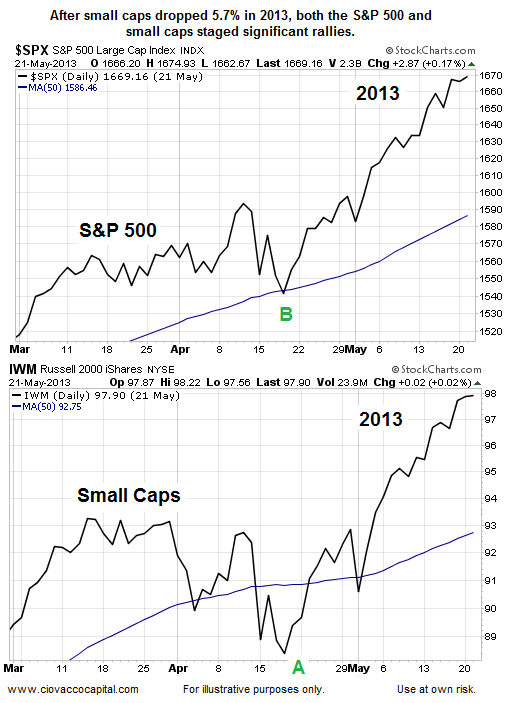
The subsequent 2013 rallies (shown above) in small caps and the S&P 500 tell us two things:
Busting Two More Small Cap Myths
If you spend any time reading about the markets, you have no doubt heard the following claims:
To examine the claims above, we found “high conviction, clearly risk-on” periods for the S&P 500; periods where the general stock market rallied convincingly for an extended period. Then, we asked ourselves:
If we review the historical charts below, the answers are clear:
We have provided historical charts for the S&P 500 and the iShares Russell 2000 Index Fund (ARCA:IWM), the small cap ETF, for your examination.
2009 - Stocks Rally Sharply Off Bear Market Low
2010: Jackson Hole Provides QE Spark For Stocks
2012: Stocks Rally Hard As Political Fears Ease
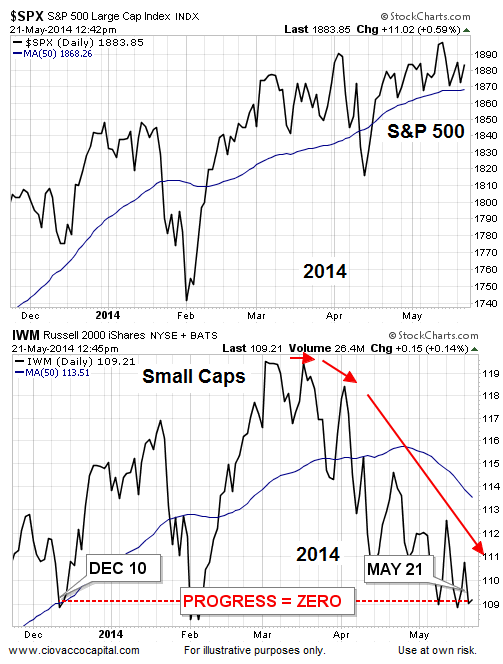
2014: Economic Doubts Still Lingering
It is troubling that small caps have made no progress between December 10, 2013 and May 21, 2014 (162 calendar days). It tells us investors are quite a bit less confident about the economy, earnings, and Fed policy relative to the second half of 2013.
2014: The Proper Way To Gain An Advantage
Many commentaries on small caps in 2014 contain the key for staying on the right side of the market. From The Wall Street Journal:
Small-cap stocks have lost their mojo, and that doesn’t bode well for the broader market. In recent weeks, investors have pulled back from the riskier corners of the stock market, and small-company stocks—which are typically more volatile than their larger brethren—have felt the brunt of the selling. Some market watchers see this as a worrisome development, fretting the broad market, at best, is stuck in neutral, or perhaps more concerning, could slump sharply if small caps don’t regain their footing.
The key to using small caps effectively as a risk management tool lies in this passage:
…the broad market…could slump sharply if small caps don’t regain their footing.
Nothing Says Small Caps Can’t Regain Their Footing
Small caps can help us improve our odds of investment success, especially from a risk-adjusted perspective. How do we use all this?
Investment Implications - Monitor and Adjust
Is all the press concerning small cap weakness relevant? Yes, when small caps are weak, it is prudent to be more risk-averse. The important thing is to monitor future developments and incoming economic data with a flexible and open mind. The odds are extremely high that if small caps and the S&P 500 stage a rally on the heels of strong fundamental data, a whole subset of investors, who have already decided the future is a bearish-only scenario, will be left behind.
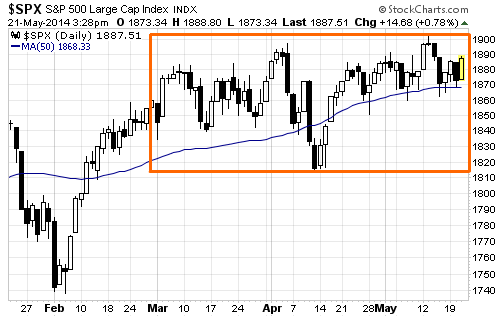
The concept of investing in “The Now” ensures that we maintain enough flexibility to adjust to both bullish and bearish outcomes. For now, the S&P 500 remains in an indecisive trading range. As shown below, Wednesday’s sharp rally did very little to break the logjam. A clear, and sustained break of 1,900 would shake things up a bit. Conversely, if the stock market and economic bears can push the S&P below 1,850, it would represent significant change.
Economic Data Could Move Markets
As long as the orange box above remains intact, we prefer to stay in a mixed and flexible stance composed of stocks (SPDR S&P 500 (ARCA:SPY)), bonds (iShares Barclays 20+ Year Treasury (ARCA:TLT), and cash. The balance of the week includes reports on employment, manufacturing, and home sales. Never a dull moment.
