
The last decade or so has witnessed a productive run of research on the ever-topical issue of detecting market bubbles in real time. Quite a lot of attention has recently been focused on a series of research studies by an academic team that includes Peter Phillips, Jun Yu and others, and rightly so. Last year’s working paper “Testing for Multiple Bubbles 1: Historical Episodes of Exuberance and Collapse in the S&P 500”, for instance, breaks new ground with econometric testing, outlining what appears to be a powerful system for detecting the arrival of irrational exuberance in asset pricing. As Fulcrum Asset Management noted earlier this year in a review of revised bubble analytics: “Recent advances in econometric methodology allow us to detect explosive dynamics in asset prices.”
Quite a lot of the new research remains centered on a rather old technique to researchers that’s based on testing for a unit root in time series, which is to say a search for periods when the data becomes non-stationary and therefore exhibits non-random and perhaps explosive behavior in a statistical sense. The most popular technique is the widely used Augmented Dickey-Fuller Test (ADF Test). As it turns out, applying the ADF Test on a rolling basis has an encouraging record of recognizing bubble-like behavior in prices. Although some of the latest methodologies are more sophisticated–such as using a recursive (expanding) window approach on the data–a 2012 study by the Bank of Finland–“Signaling asset price bubbles with time-series methods”–found that a basic rolling-window process also does a good job of finding those periods when prices appear to be unusually bubbly.
Inspired by the Bank of Finland’s research, I kicked the tires on the idea of applying an ADF Test on the US stock market (S&P 500). The results are encouraging. Here’s the basic set-up. First, I used monthly data (based on month-end closes) from 1950 through this month (August 8, 2014, which proxies as the latest “month-end” close). Next, I applied an ADF Test on a rolling 36-month basis in R via the adf.test function in the “tseries” package, and letting the software choose the lag order (which defaults to 3 in this case).
The output of interest: the so-called p-values. In particular, when the p-values are high (approaching 1.0), we have strong evidence for rejecting the null hypothesis, i.e., that the data series is stationary. The put this into plain English, when the p-value is elevated, that’s a robust signal for thinking that we’re in bubble territory. One has to be careful here since bubbles can persist. As the old saying goes, markets can remain irrational for longer than you can stay solvent.
In any case, the empirical results look quite good. First, consider how the S&P 500 compares in recent decades via the prism of a rolling 36-month ADF Test:
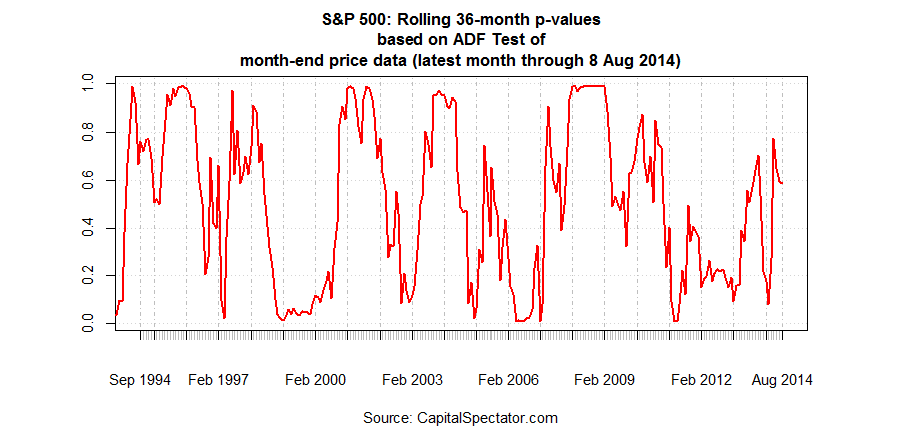
When the p-values are at or above 0.95, that’s been a fairly reliable indicator that the market’s near a short-term top. Whether we call such periods a bubble or not is irrelevant. A more productive issue is developing an objective measure in an econometric sense for deciding if prices are unusually lofty and therefore at higher-than-normal risk of suffering a fresh bout of mean reversion.
As it turns out, our simple example looks valuable in this task. As one example, p-values generated by the procedure outlined above shot up to 0.93 in January 2008 and then inched over the 0.95 mark in February and stayed there through February 2009. In short, this methodology of bubble testing offered a relatively early warning of high risk—a timely warning, as it turned out, as it arrived ahead of the market crash in late-2008.
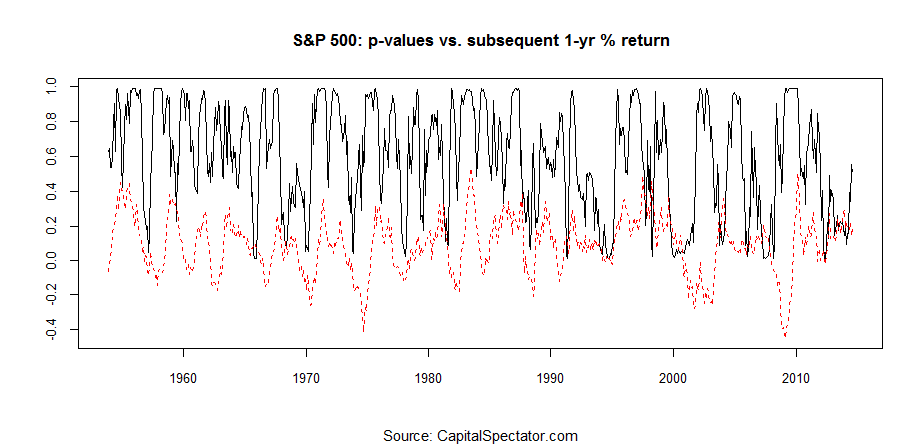
As another test, consider how the p-values compare with the subsequent one-year returns for the S&P 500 through the decades. As the second chart below shows, extremely high p-values (black line) tend to be associated with low/negative returns for the S&P for the one-year performance 12 months ahead (dotted red line).
On that note, the current p-value (based on the data through August 8) falls short of a clear bubble signal. Although the p-values have shot up recently, the current 0.59 reading leaves plenty of room for debate about bubble risk.
To be fair, there are many alternative ways to test for bubbles, but the approach outlined above has a decent record. It doesn’t hurt that it’s simple and offers an intuitive process for crunching the numbers. Is it foolproof? No, but nothing else is either. But when you combine this test with other techniques (such as looking for “regime shifts” in the stock market via a Hidden Markov model) you can make a fair amount of progress in extracting valuable information from data sets that are available in real time and are immune to revision… aka prices.