Get 40% Off
🚨 Volatile Markets? Find Hidden Gems for Serious OutperformanceFind Stocks Now

Broad Selling, But Not All Indices In True Bearish Mode

Published 07/27/2015, 12:35 AM
Updated 07/09/2023, 06:31 AM

There was no doubt as to the nature of Friday's action. A weak, end-of-week close adds to the negative tone, suggesting the damage is more long term. However, not all indices are in true bearish mode.

The S&P is stuck inside its range, and won't be challenging range lows until 2,045 comes into play. The 200-day MA at 2,063 is an area to look for buyers, although the last test of this key moving average was in early July, which is a little too soon for a new test to hold again. Technicals are mixed, which fits with what is trading range action. Bears may win in the long term, but bulls may get some joy at the 200-day MA for a short term bounce play.
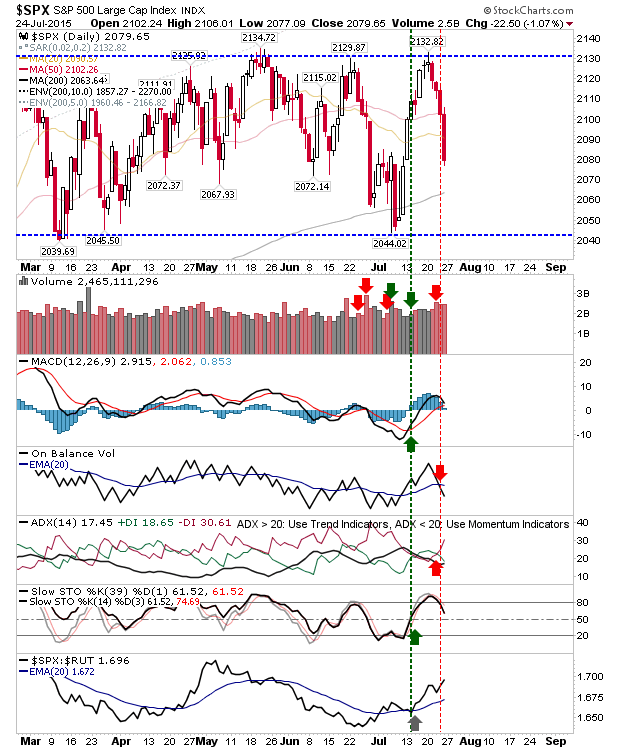
SPX Daily Chart

The Dow is not playing so well. It's struggling with a potential break of the trading range, not something S&P traders will want to see succeed. The undercut of the 200-day MA with a new lower high looks quite damaging. Add a new distribution day, one of a recent sequence of three, piles on the bearish pressure. Net bearish technicals is the final icing on the cake. Bulls won't regain control until 18,200 is breached to the upside, but a recovery above 17,625 would force shorts to cover and offer bulls something to work with over the next couple of days.
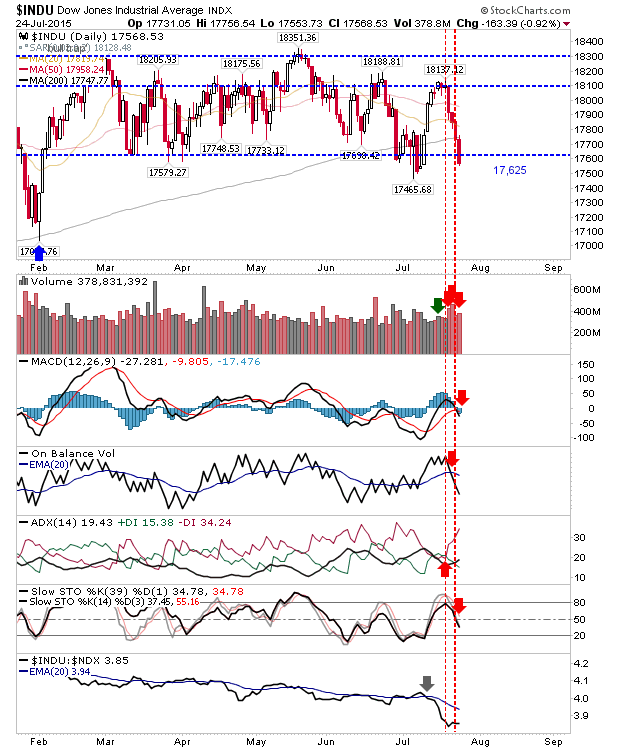
INDU Daily Chart


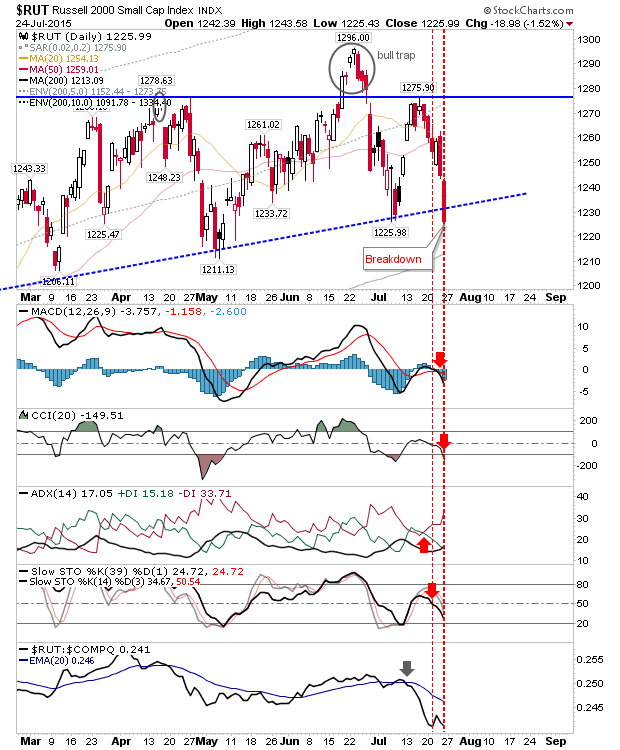
Damaging is the action in the Russell 2000. The index lost rising trendline support, but it will quickly find itself up against the 200-day MA; a test last (successfully) made in January. Technicals are net negative. The next major support test will be 1,100.
3rd party Ad. Not an offer or recommendation by Investing.com. See disclosure here or remove ads .

RUT Daily Chart


The Semiconductor Index took heavy losses, bringing it back to lows. A strong 'sell' trigger remains in play with the MACD.
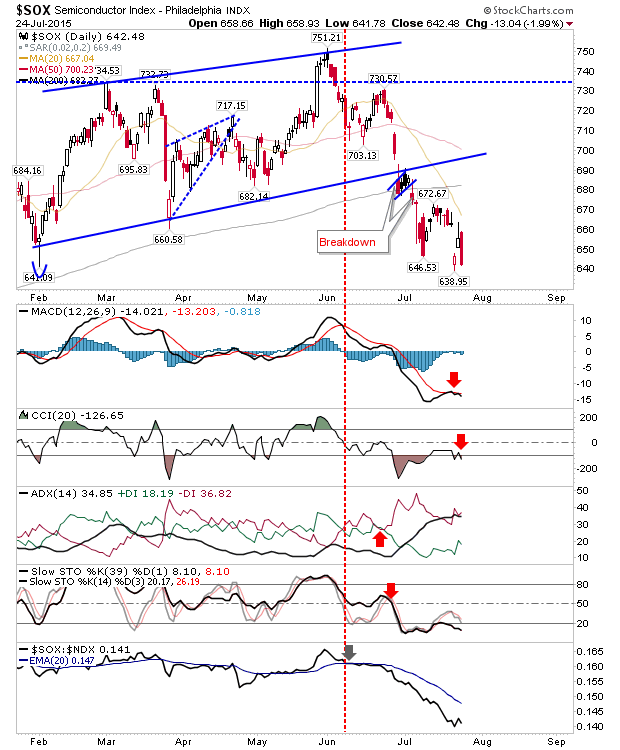
SOX Daily Chart


The Nasdaq is working off a 'bull trap', but only has one supporting technical on a 'sell' trigger. It also has converged 20-day and 50-day MAs to lean on too. If buyers are able to step up to the plate on Monday, then the tech indices may be the one to deliver the reward.
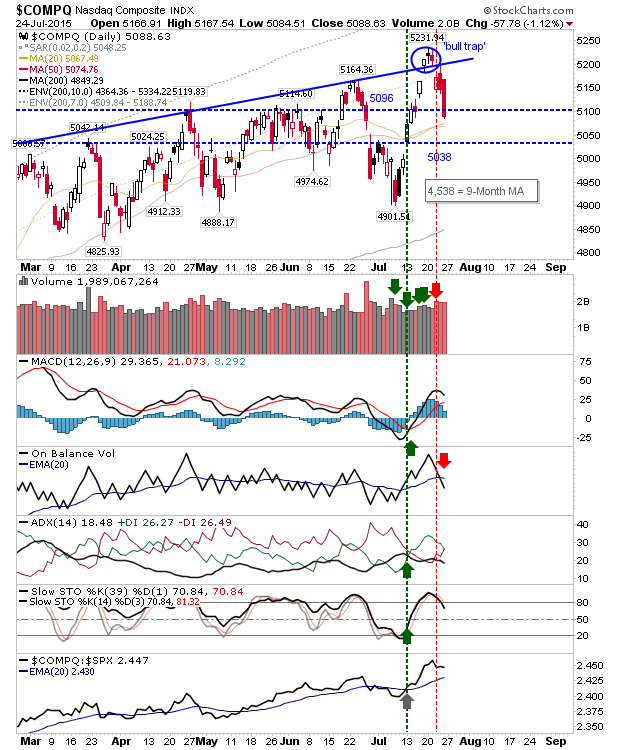
Nasdaq Composite Daily Chart


After the series of hard hits last week, tomorrow may see a more positive start. Tech indices are best positioned to see a long term benefit, but the Dow may offer the lowest risk going forward given its proximity to range support.

Latest comments

Risk Disclosure: Trading in financial instruments and/or cryptocurrencies involves high risks including the risk of losing some, or all, of your investment amount, and may not be suitable for all investors. Prices of cryptocurrencies are extremely volatile and may be affected by external factors such as financial, regulatory or political events. Trading on margin increases the financial risks.
Before deciding to trade in financial instrument or cryptocurrencies you should be fully informed of the risks and costs associated with trading the financial markets, carefully consider your investment objectives, level of experience, and risk appetite, and seek professional advice where needed.
Fusion Media would like to remind you that the data contained in this website is not necessarily real-time nor accurate. The data and prices on the website are not necessarily provided by any market or exchange, but may be provided by market makers, and so prices may not be accurate and may differ from the actual price at any given market, meaning prices are indicative and not appropriate for trading purposes. Fusion Media and any provider of the data contained in this website will not accept liability for any loss or damage as a result of your trading, or your reliance on the information contained within this website.
It is prohibited to use, store, reproduce, display, modify, transmit or distribute the data contained in this website without the explicit prior written permission of Fusion Media and/or the data provider. All intellectual property rights are reserved by the providers and/or the exchange providing the data contained in this website.
Fusion Media may be compensated by the advertisers that appear on the website, based on your interaction with the advertisements or advertisers.
© 2007-2024 - Fusion Media Limited. All Rights Reserved.