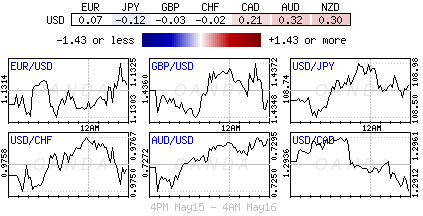
Tuesday May 17: Five things the markets are talking about
The Fed is having a tough time getting its own message across; you know the one that U.S rate normalization has begun. The Fed believes that market participants are caught behind the curve; by under pricing future Fed rate hikes.
Later this morning, in this holiday shortened trading week, the market gets to chew on U.S inflation numbers. Perhaps today’s release may convince a few of the unconverted that when the Fed mentions a meeting is ‘live’ they may not just be paying lip service.
Today’s release is important. Currently, with the U.S core inflation print already above the Fed’s desired target of +2%, coupled with the Fed’s preferred measure (PCE) just shy (+1.6%), it will only take one or two more consistent inflation prints to convince the Fed to pull that rate trigger of theirs.
1. RBA minutes surprise markets
The Reserve Bank of Australia (RBA) initiated a surprise rate earlier this month to a new record low (+1.75%) on the back of low inflation and slower global growth. However, the RBA meeting minutes released overnight indicate that the decision was a tight call, as members also considered waiting for more data before acting.
The less than ‘dovish’ report indicated that there has not been a material change in the outlook for Aussie economic activity or the unemployment rate, but the outlook for inflation had been revised lower.
The RBA was also “optimistic” that China policy support would address that economy’s slowdown.
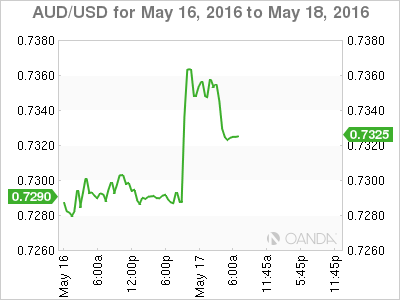
The nest result surprised the Aussie asset bear’s. Yields backed up a tad (three-year bond yields rallied +3bps), while the AUD drifted away from this week’s lows (A$0.7360). The S&P/ASX managed to pare some of its early opening gains.
2. Oil soars to six-month high
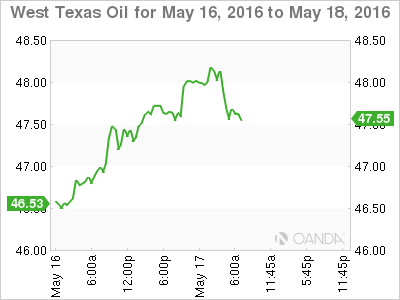
U.S oil stock data later today is expected to show that U.S. crude stockpiles have fallen for a second week. Net result, crude prices have advanced again to fresh six-month prints in overnight trading (WTI $47.79) and by default, its boosting equity energy names.
In a note penned by Goldman Sachs analysts’ over the weekend, they indicate that the market supply has reversed course and entered “deficit” territory. The global “supply glut” that bear speculators have been relying on seems to have been soaked up by supply disruptions and sustained demand.
Traders continue to monitor a number of event risks that are having a material impact on global supply. There is political upheaval in Venezuela as well as oil delta sabotage in Nigeria and wildfires in Canada.
At such elevated prices, expect off line production to be tempted back and possibly temporary cap crude prices.
3. Treasury yields back up
Demand for safe-haven bonds retreats a tad overnight as U.S oil futures print new yearly highs. To many, higher crude prices are seen as a proxy for “risk-taking” and an inflation risk.
Today’s CPI numbers will tell us whether U.S prices remain contained or not. So far, new debt sales have not been able push up Treasury yields significantly (10-years +1.75%). Why? Overseas demand continues to push money into the U.S debt market as they scour the world for a return now that Central Banks are playing with negative interest rate policies (NIRP).
Japanese investors remain a big fan of U.S Treasury bonds. Institutional investors from Japan helped drive last week’s record demand – 73.5% indirect bidding on Wednesday’ 10-year auction (yield +1.714%).
4. Yen falls broadly
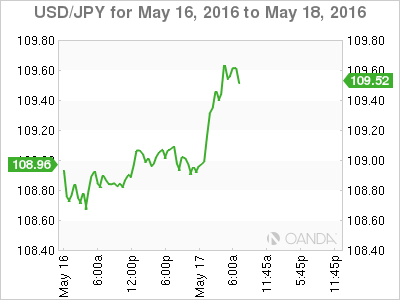
USD/JPY moves of late are either intervention related or on risk appetite.
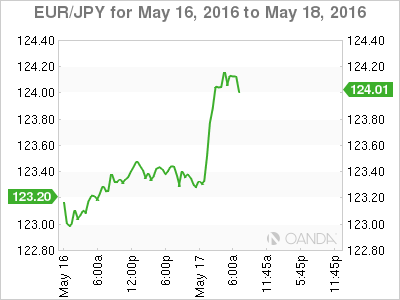
Overnight, yen has underperformed across the board, falling to a new three-week low outright (¥109.64) as investor risk appetite improves – global bourses have been able to hold onto their gains as we head to the open stateside.
EUR/JPY gains are around +0.55%, while GBP/JPY rises +0.8%, having also hit a two-and-a-half week high just shy of £159.00.
AUD/JPY jumps +1%, with AUD broadly firmer after last nights “less dovish” RBA minutes.
5. U.K inflation below expectation
Data this morning shows that U.K. inflation eased last month, down to +0.1% from +0.5% in March, more proof that the U.K is not immune to sluggish global growth.
The major drivers of the change to U.K CPI are transport, with air ticket prices falling by -14.2% m/m, compared with a +4.5% rise a year ago. Similarly, the figures recorded a -0.4% drop in clothing prices over the two-months, against a +0.9% rise the previous year.
The pound was initially trading above the psychological £1.45 level for a new one-week high print in the Euro sessions, again supported by recent Brexit polls (+55% vs. +40% to exit).
However, another poll (TSN online poll) has put the “leave” camp in front for the first time in three-months. Sterling is coming under pressure ahead of the U.S open (£1.4465).
