Trading recommendations
Sell Stop 53.20. Stop-Loss 54.20. Take-Profit 53.00, 52.25, 51.10, 50.70, 50.00, 48.00
Buy Stop 54.40. Stop-Loss 53.20. Take-Profit 55.15, 55.60, 56.00
Technical analysis
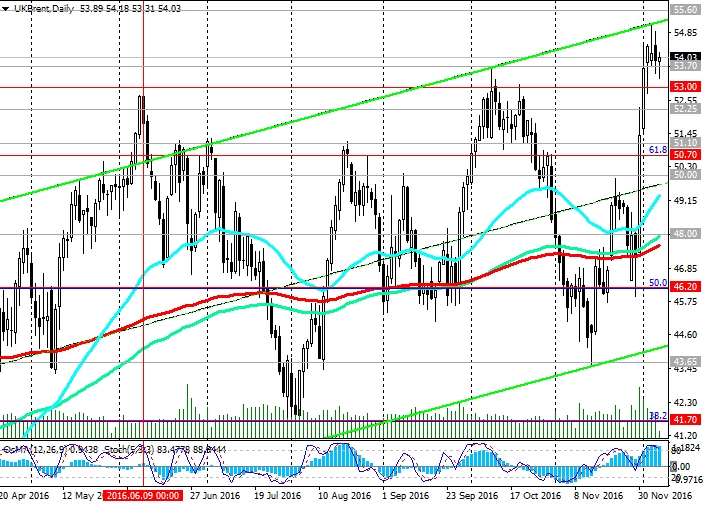
After oil prices soared 15% last week to new highs over the past 5 weeks, on Monday the price is still the most copied above $55.15 per barrel of Brent crude oil. However, today, the second day, as the price of oil drops in the first place - against the background of investors lock profits and closing long positions.
At the beginning of the European session on Wednesday, the price of Brent crude is near the level of 53.60.
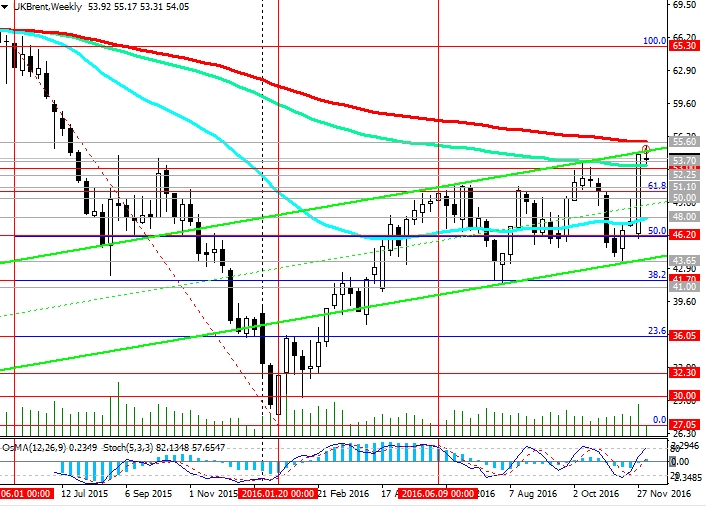
Indicators OsMA and Stochastic on the weekly, monthly charts are on the side of buyers, however, on the 4-hour and daily charts - turned to short positions.
In the case of continuation of decrease in immediate short-term goals can become support levels 53.00, 52.25. Critical to the upward trend may be returned prices below the levels of the zone 51.10, 50.70, 50.00. In case of breakdown of the price level of 50.00 will return to the support level 48.00 (EMA200, EMA144 on the daily chart, EMA50 on the weekly chart).
The breakdown of the 46.20 level will cause a further decline with the purposes 43.65 (50.0% Fibonacci retracement level), 41.70 (Fibonacci level of 38.2%). Breakdown level 41.70 (38.2% Fibonacci level and the lows of July / August), may lead to the beginning of a new wave of lower oil prices. Dollar rises in price, and the current oversupply of oil in the world will restrain the growth of oil prices. And if you have problems or difficulties in the implementation of the OPEC agreement to cut production cost may again begin to decline.
In the case of upward trend price will go to the resistance level of 55.60 (EMA200 on the weekly chart).
Support levels: 53.00, 52.25, 51.10, 50.70, 50.00, 48.00, 47.00, 46.20, 44.30, 43.65, 41.70, 41.00
Resistance levels: 55.15, 55.60
Overview and Dynamics
After tonight was published a report of the American Petroleum Institute (API) oil prices fell, despite the decline in US oil inventories. Last week, US crude stocks fell by 2.2 million barrels. At the same time gasoline inventories rose by 0.83 million barrels, distillate stocks - by 4 million barrels.
Earlier, prices rose sharply on the decision of OPEC to reduce oil production by 1.2 million barrels, which is equivalent to about 1% of world oil production. The deal was the first successful attempt to reduce oil production since 2008 and has led to an increase in oil prices by more than 15% last week. Spot price for Brent crude this week reached the mark of $ 55.10 per barrel. However, the price of oil drops.
Oil futures also fell to yearly highs due to profit-taking by traders. Futures for gasoline dropped in price by 1.4% to 1.5359 dollars per gallon, while futures for diesel fuel fell by 1.2% to 1.6379 dollars per gallon. The participants of the oil market also fear that oil production cartel will continue to grow, probably, before the date of the transaction. Saudi Arabia is likely to be expected in January, in line with the season to reduce its oil production to a lower level of winter.
Production within OPEC in November rose to new record highs. At the same time Saudi Arabia has reduced the January prices for Asian consumers as part of its strategy to protect market share. On Saturday, the OPEC is scheduled to meet with countries not members of the cartel, including Russia, which has promised to accede to the decision to limit oil production. The cartel expects other oil-producing countries cut production by 600,000 barrels per day.
If it does not, then the price of oil will react to decline and vice versa. In the case of reaching an agreement with the other countries of OPEC to reduce the production price of oil will resume growth, despite the skepticism of some members of the oil market.
Today at 15:30 (GMT) US Department of Energy publishes its weekly report on US oil storages and petroleum products. According to the forecast expected decline in stocks at 1.132 million barrels. Reducing inventories usually support oil prices. However, the agreement on the limitation of oil production will be the main driver in the dynamics of oil prices. The excess of supply over demand is still on the agenda. In the United States increases the number of active drilling rigs, as the new US president Donald Trump promises to lift the restrictions on the production of energy in the United States.
OPEC agreement to cut production in the conditions of competition for market share could be in jeopardy.
Author signals - https://www.mql5.com/en/signals/author/edayprofit
*)presented material expresses the personal views of the author and is not a direct guide to conduct trading operations.


