Get 40% Off
🚨 Volatile Markets? Find Hidden Gems for Serious OutperformanceFind Stocks Now

Brent Breaks Out Of Bearish Wedge; Is The Rally Over?

Published 07/07/2015, 07:56 AM
Updated 07/09/2023, 06:31 AM

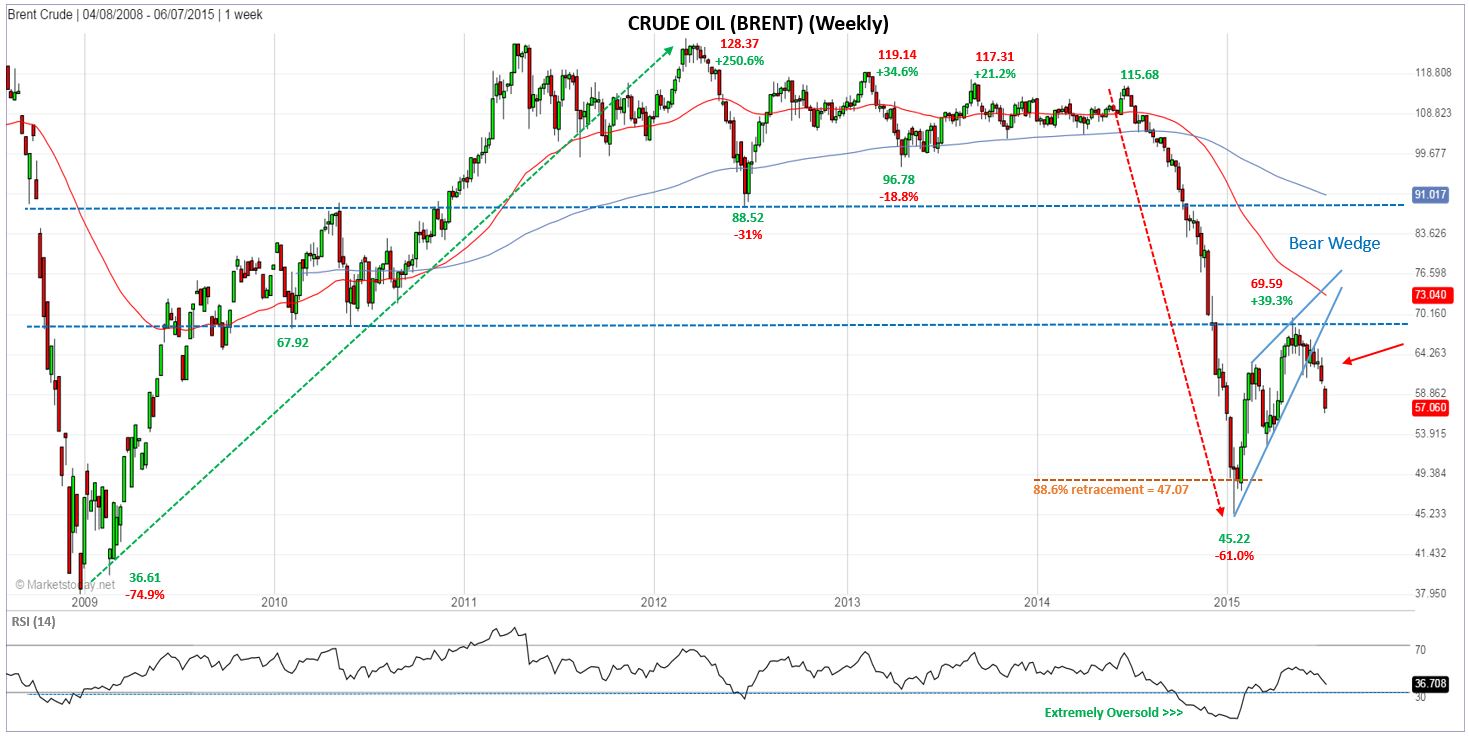
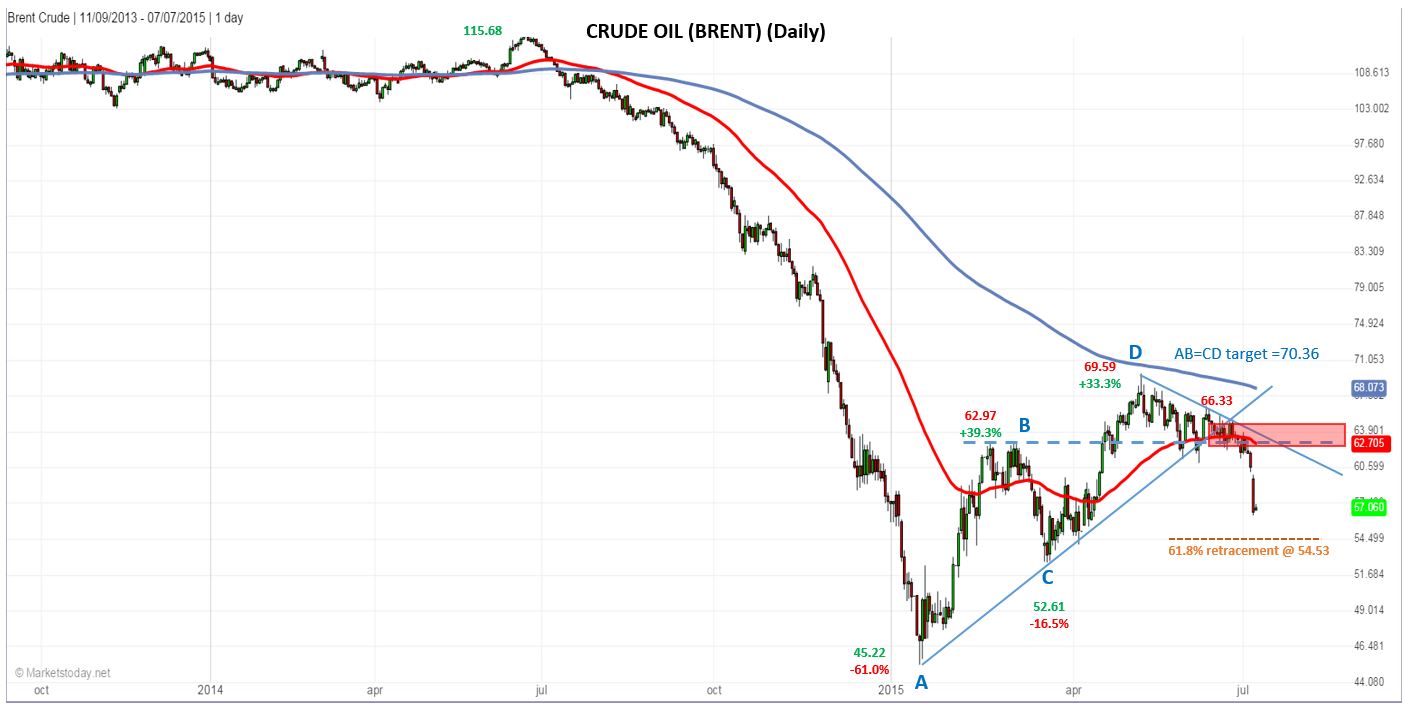
Brent Crude broke down from a bearish rising wedge formation several weeks ago, trading relatively sideways thereafter, until the tail end of last week when it fell below and closed below $60.97. The 50% retracement at $57.41 was surpassed yesterday to the downside, with the next target being around the 61.8% Fibonacci retracement level at $54.53, followed by the most recent swing low (C) at $52.61.
Brent Weekly
There’s only been one leg down since the bearish breakout, so rallies up into resistance can be used to get out of long positions or enter new shorts. Resistance could be found around the short-term downtrend line (see the daily chart, below), followed by around $62.71/62.97, consisting of the 55-day exponential moving average (ema) and a previous peak, respectively. Those price areas then start a potential resistance zone up to approximately 66.33, consisting of a prior consolidation phase.

A rally above $66.33 could change the outlook to bullish, depending on how Brent arrived at that price level.
Brent Daily

On May 6th, Brent peaked at $69.59, just 1% shy of completing a perfect AB=CD pattern, and just under resistance of the 200-day ema. This, combined with the breakout of the bearish wedge, points to the possibility that the rally in Brent has come to an end. The wedge breakout is a classic trend continuation pattern and so far it is signaling that the downtrend that started a little over a year ago will continue. Watch the level of strength in the next rally for signs of what’s to come.

3rd party Ad. Not an offer or recommendation by Investing.com. See disclosure here or remove ads .

Based on the wedge pattern alone, the target from the breakout is the beginning of the pattern at 45.22.

Latest comments

Risk Disclosure: Trading in financial instruments and/or cryptocurrencies involves high risks including the risk of losing some, or all, of your investment amount, and may not be suitable for all investors. Prices of cryptocurrencies are extremely volatile and may be affected by external factors such as financial, regulatory or political events. Trading on margin increases the financial risks.
Before deciding to trade in financial instrument or cryptocurrencies you should be fully informed of the risks and costs associated with trading the financial markets, carefully consider your investment objectives, level of experience, and risk appetite, and seek professional advice where needed.
Fusion Media would like to remind you that the data contained in this website is not necessarily real-time nor accurate. The data and prices on the website are not necessarily provided by any market or exchange, but may be provided by market makers, and so prices may not be accurate and may differ from the actual price at any given market, meaning prices are indicative and not appropriate for trading purposes. Fusion Media and any provider of the data contained in this website will not accept liability for any loss or damage as a result of your trading, or your reliance on the information contained within this website.
It is prohibited to use, store, reproduce, display, modify, transmit or distribute the data contained in this website without the explicit prior written permission of Fusion Media and/or the data provider. All intellectual property rights are reserved by the providers and/or the exchange providing the data contained in this website.
Fusion Media may be compensated by the advertisers that appear on the website, based on your interaction with the advertisements or advertisers.
© 2007-2024 - Fusion Media Limited. All Rights Reserved.