Stocks and markets were looking so good last weekend but their actions were to the contrary in the week just past.
Weakness set in hard an continued and I had to go back to a cash position for a couple days but Friday saw some great V bottom type of patterns emerge and I’m moving back into a few stocks now for a bounce.
It’s never fun when such fast corrections come but they do come and all you can do is deal with them and then be ready for the next setup and move.
The metals hit resistance levels and as often happens, they overshot those resistance levels and are now moving back below them which is a short sell signal.
Let’s take a look at the precious metals and see where we should find support next.

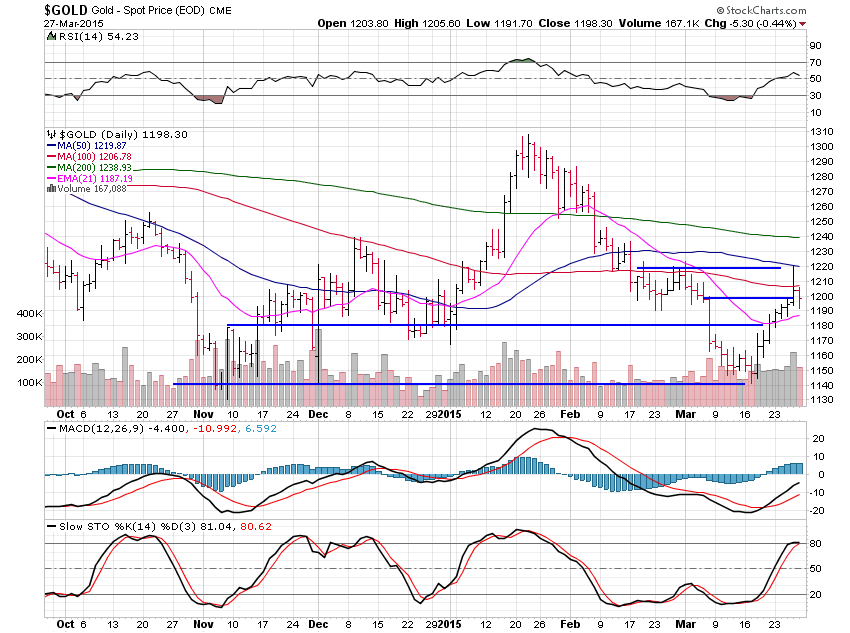
Gold gained 1.4% for the week and backed away very predictably off resistance levels.
The 50 day moving average at $1,220 was perfect resistance for gold and now we are moving back below the $1,220 resistance level where many subscribers shorted gold Friday.
The big counter-trend rally that was sparked by the Fed speak looks to be over now and I mentioned last weekend that rallies on Fed speak generally don’t last long in the golden realm.
Support still sits at $1,180 and then below at $1,140 so we just have to watch and see how gold behaves at those areas and every evening I’ll tell subscribers what I see in detail and they can play it accordingly but for now, being short is the play.

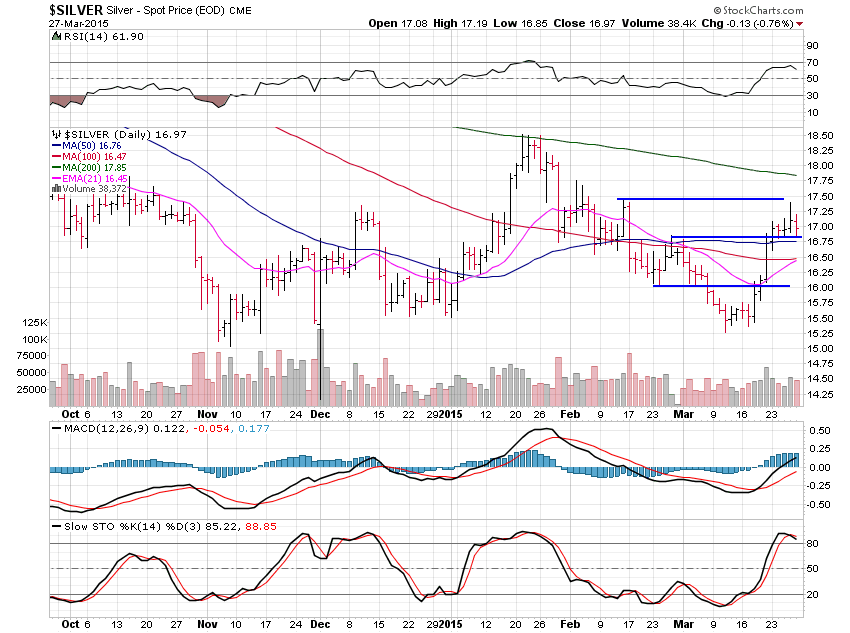
Silver gained 1.46% for the week and found resistance at $17.50 before showing signs of rolling over now.
Gold is leading silver for the time being.
A move under $16.75 is the short level for silver and it’s got moving average support at $16.50 and below that is $16.
I may use a levered ETF to short some silver Monday as long as gold remains leading and looking weak.

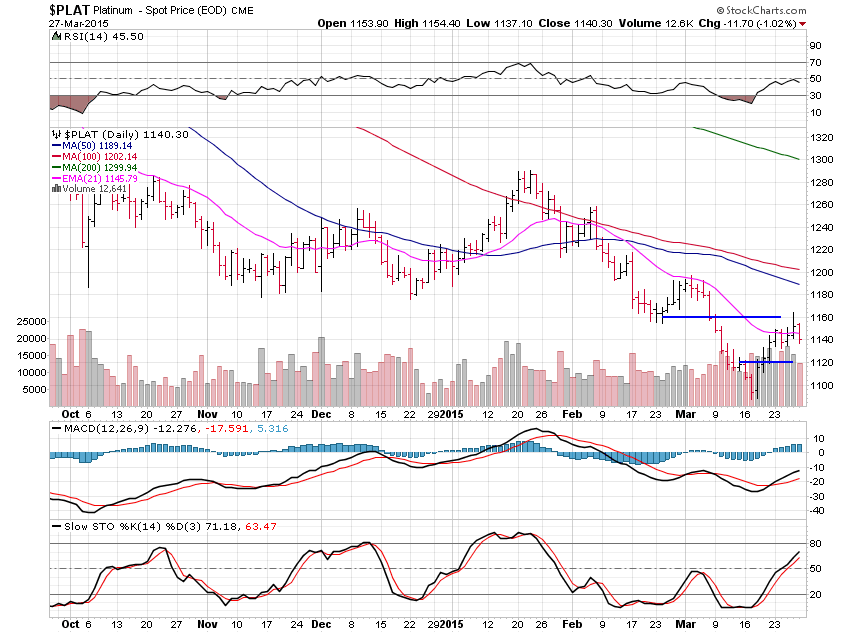
Platinum saw a 0.25% rise over the past week and is also rolling over now.
$1,160 resistance was hit and is holding and as always, platinum follows gold so it looks like it has further to fall.
Minor support sits at $1,120 and then if that breaks we should head back into new low territory under $1,100 pretty quickly.
The dominant trend remains lower for the precious metals while it is higher for stocks so shorting strength in the metals and buying dips in stocks remains the way to play it.

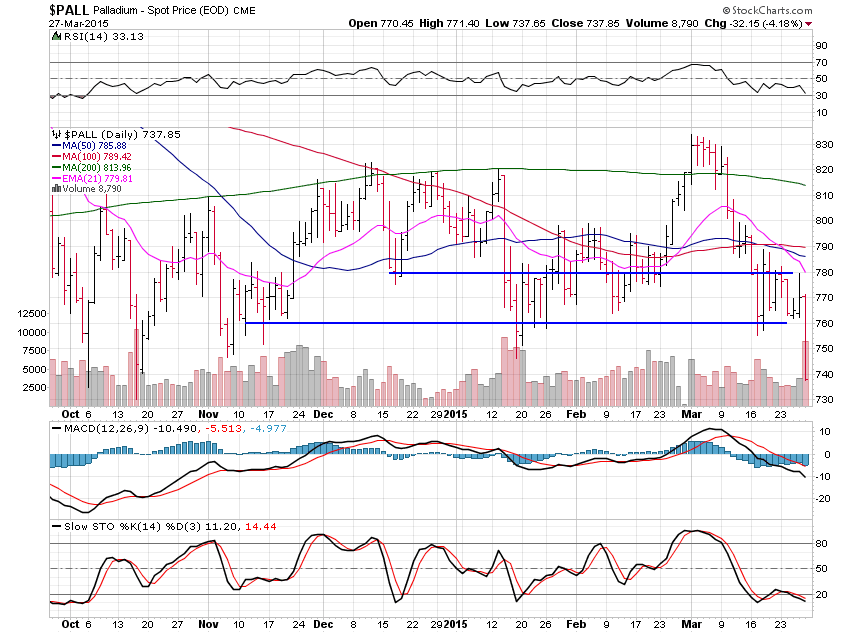
Palladium lost a hefty 5.04% this past week and is showing very weak action on heavy volume.
There is some good support at the $700 area and at this rate palladium will be there quickly.
My focus for subscribers this weekend is finding the stocks in the right sectors who’ve held up best and also those who are showing V bottom patterns which can give large gains in very short order.