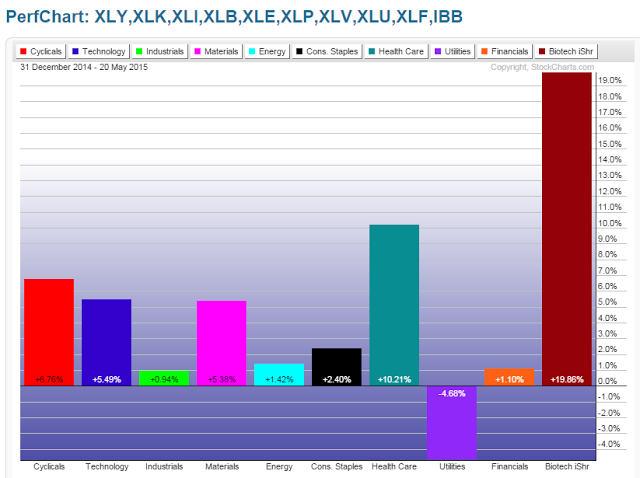
As can be seen from the Year-to-Date graph below of the 9 Major Sectors plus the Nasdaq Biotech ETF (NASDAQ:IBB), IBB has outperformed all of the 9 Major Sectors, so far this year on a percentage-gained basis (by a margin of almost 2:1 over the highest Sector performer, that being Healthcare).

Does this, alone, mean that Biotech has reached its peak for the year? To look further into that question, I present the following three Daily charts, below:
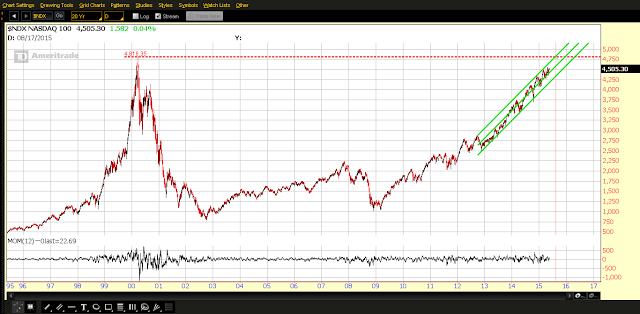
- Nasdaq 100 Index (NDX)
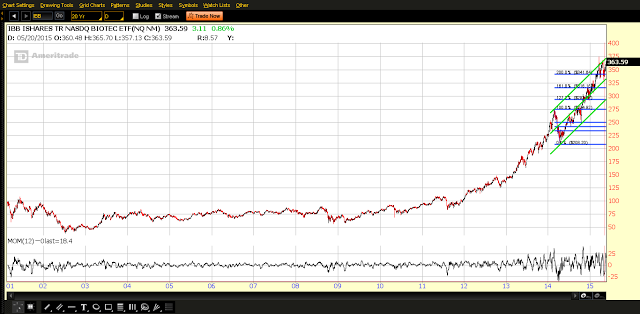
- Nasdaq Biotech ETF (IBB)
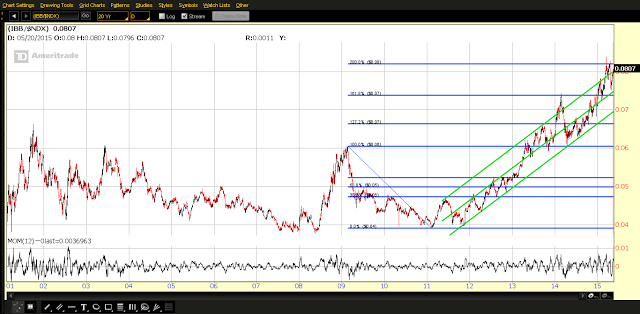
- IBB:NDX Ratio
First, we'll look at where the NDX is sitting. Its all-time high is 4816.35. Price closed yesterday (Wednesday, May 20th), at 4505.30 and is almost midway between the middle and upper channel (which began mid-November 2012). Over the longer-term, price can run up another 311.05 points before hitting the top of its channel and, at the same time, touching its all-time high by around mid-to-late August of this year (if it rises to and rides along the upper channel from now until then).

Second, price action on IBB has been very whippy since it hit its all-time of 374.97 on March 20th and is trading in a range that is sitting above a 200% external Fibonacci Retracement level (which currently forms major support at 341.64). We may see a final thrust of price up to retest its all-time high to form a double top (and sloppy triple top) before it, once again, runs into major resistance at the top of its channel. We could see some major profit-taking occur at that level, with possibly lower-lows made as well, breaking below the 200% Fib level and the middle of its channel in the process.

The last chart shows the recent under-performance of the IBB compared to the NDX. Price is sitting in between a 200% external Fibonacce Retracement level and the top of its channel. However, the Momentum indicator is showing recent strength of IBB, so I'd watch price action on this ratio chart to see whether it either breaks and holds above major resistance (above the 200% Fib level), or breaks and holds below major support (the top of the channel), for possible clues on near-term strength or weakness.

I think that by following all three charts above, you'll have a more complete picture of near-term and longer-term strength or weakness in Biotechs.
