Get 40% Off
👀 👁 🧿 All eyes on Biogen, up +4,56% after posting earnings. Our AI picked it in March 2024.
Which stocks will surge next?
Unlock AI-picked Stocks

Big Move Brewing For Gold

Published 08/17/2014, 11:01 PM
Updated 07/09/2023, 06:31 AM

A series of lower highs/higher lows often leads to the formation of a symmetrical triangle (coil). Such is the case currently with Gold which has been coiling for weeks near an important price memory zone near $1300:
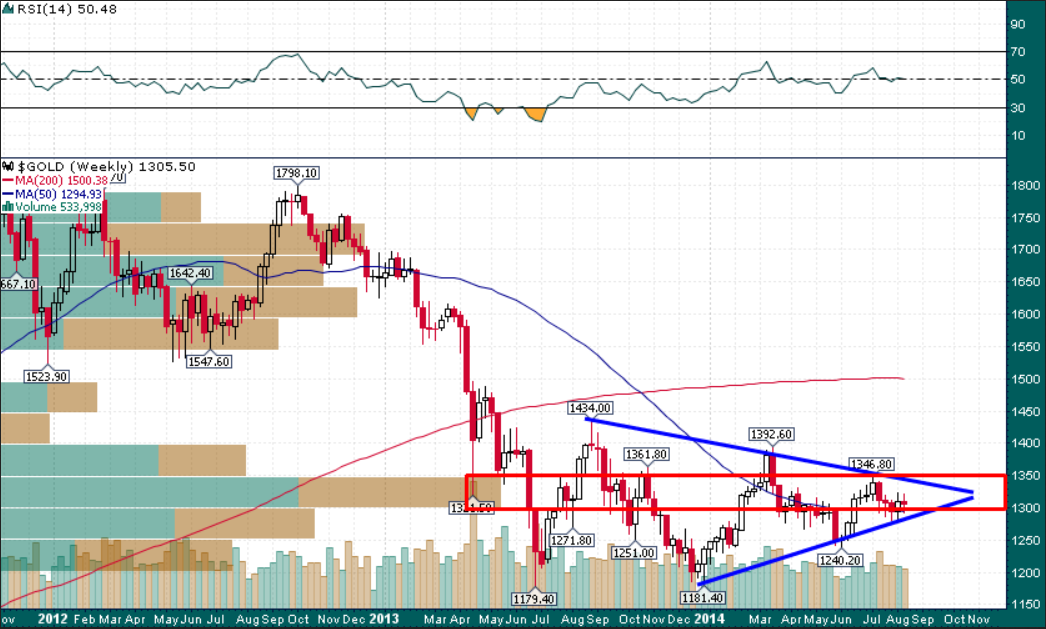
Gold Weekly

Since the April 2013 gold crash, the $1300-$1325 area has served as a powerful magnet for price. With the coil tightening recently, the probability of a decisive breakout from the range have increased significantly – from the stockcharts.com section on symmetrical triangles:

“The ideal breakout point occurs 1/2 to 3/4 of the way through the pattern’s development or time-span. The time-span of the pattern can be measured from the apex (convergence of upper and lower lines) back to the beginning of the lower trend line (base).

Edwards and Magee suggest that roughly 75% of symmetrical triangles are continuation patterns and the rest mark reversals. The reversal patterns can be especially difficult to analyze and often have false breakouts. Even so, we should not anticipate the direction of the breakout, but rather wait for it to happen. Further analysis should be applied to the breakout by looking for gaps, accelerated price movements, and volume for confirmation. Confirmation is especially important for upside breakouts.”

With the symmetrical triangle at roughly its 3/4 point, a resolution during the next week would be potentially quite powerful. While the Edwards and Magee statistic regarding symmetrical triangles as continuation patterns is certainly true most of the time, from my estimation the current setup in gold is a coin flip; the volume-by-price ‘air pocket’ between $1400 and $1500 offers a tantalizing upside target, seasonality is very bullish for the next 6 weeks, and sentiment remains quite downbeat, whereas the trend since late-2012 is clearly lower and price has been unable to sustain above $1320 for any significant period of time.

3rd party Ad. Not an offer or recommendation by Investing.com. See disclosure here or remove ads .

The CBOE Gold Volatitity Index (GVZ) also offers reason to believe a big move in gold could happen very soon:
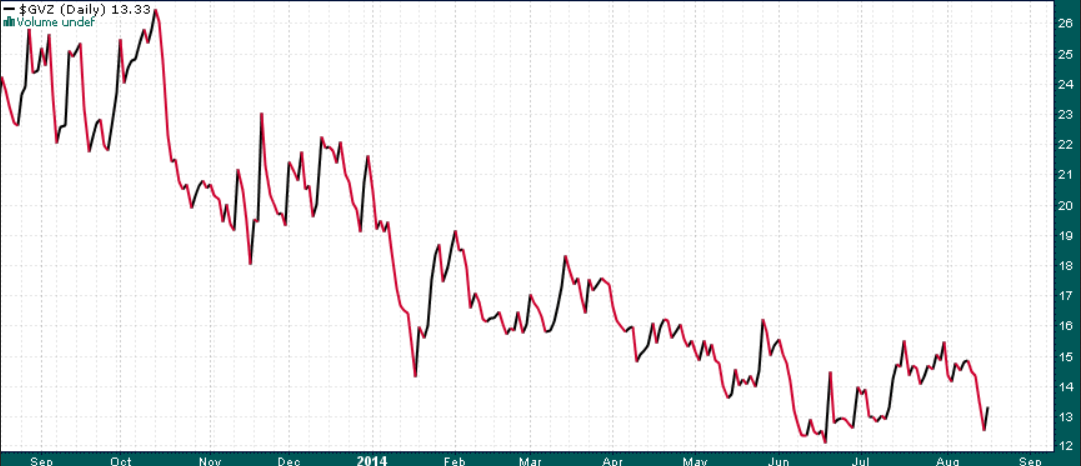
GVZ Daily

As evidenced by the above chart, the tightening range in the gold price has lulled options market participants into a relative sense of complacency. Historically when the GVZ has fallen to such low levels a large move in gold was not far away:
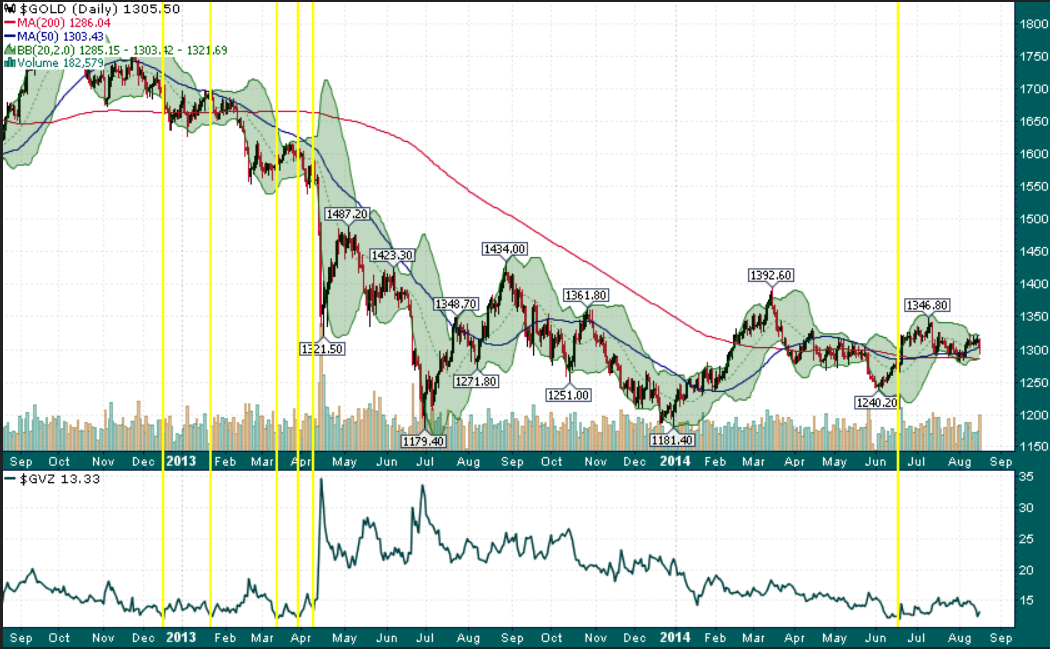
Gold Daily vs GVZ

While the technicals paint a mixed picture in terms of price direction, there are mounting signs that a big move is brewing for gold….

Latest comments

agree on the seasonality front.... waiting fr the breakout to happen .... . https://www.tradingview.com/v/Zs3kYrzU/
A "pocket between 1400 and 1500?? Wow that is dreaming. Gold wont even get close to that area. Still in a bear market and the bear is going to make some noise very soon!!
its a continuation pattern but you dont have any downside targets? see the one chart I posted on this site pls
Risk Disclosure: Trading in financial instruments and/or cryptocurrencies involves high risks including the risk of losing some, or all, of your investment amount, and may not be suitable for all investors. Prices of cryptocurrencies are extremely volatile and may be affected by external factors such as financial, regulatory or political events. Trading on margin increases the financial risks.
Before deciding to trade in financial instrument or cryptocurrencies you should be fully informed of the risks and costs associated with trading the financial markets, carefully consider your investment objectives, level of experience, and risk appetite, and seek professional advice where needed.
Fusion Media would like to remind you that the data contained in this website is not necessarily real-time nor accurate. The data and prices on the website are not necessarily provided by any market or exchange, but may be provided by market makers, and so prices may not be accurate and may differ from the actual price at any given market, meaning prices are indicative and not appropriate for trading purposes. Fusion Media and any provider of the data contained in this website will not accept liability for any loss or damage as a result of your trading, or your reliance on the information contained within this website.
It is prohibited to use, store, reproduce, display, modify, transmit or distribute the data contained in this website without the explicit prior written permission of Fusion Media and/or the data provider. All intellectual property rights are reserved by the providers and/or the exchange providing the data contained in this website.
Fusion Media may be compensated by the advertisers that appear on the website, based on your interaction with the advertisements or advertisers.
© 2007-2024 - Fusion Media Limited. All Rights Reserved.