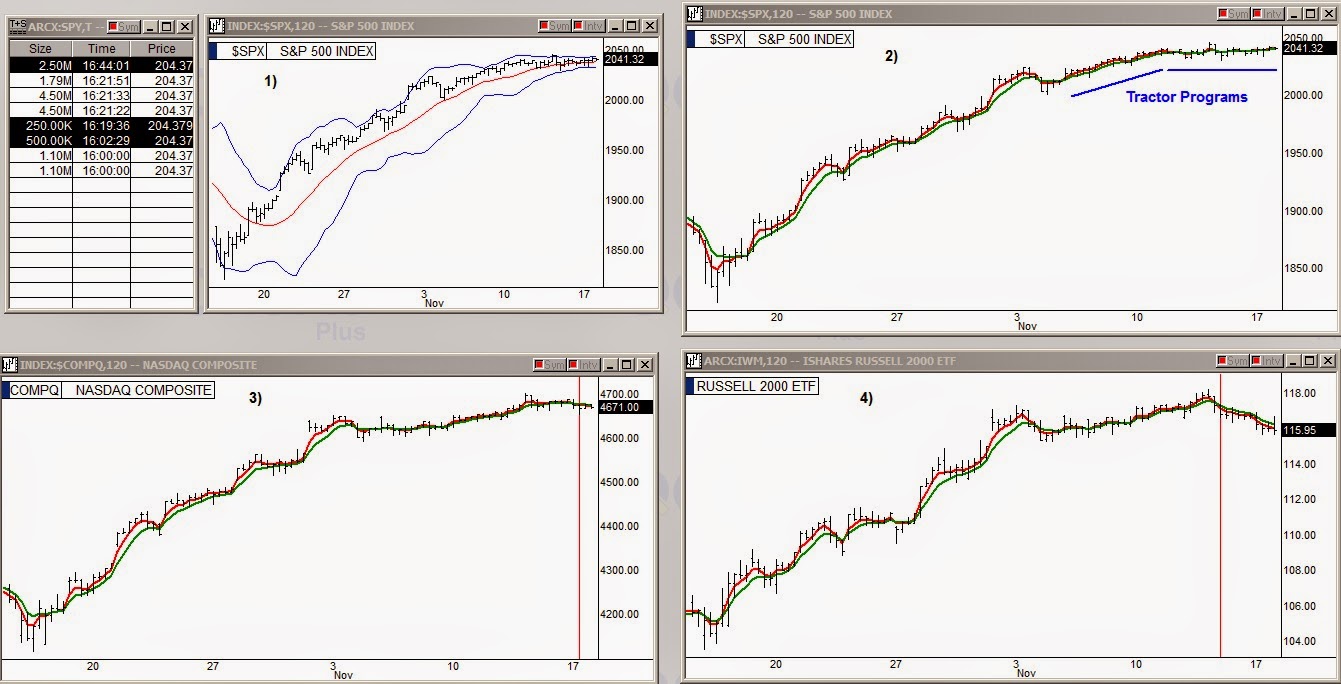
In the market Monday we had another day of the horizontal tractor program that has been running the past week and a half on the SPY. This is actually the second tractor program since the Advance Decline divergence began three weeks ago which I focused on in my previous article. Chart 2 above has the two tractor programs marked in blue lines and shows the EMA pair whose up cross marked the beginning of the rally and shows that they still have not down crossed on the S&P 500. However, in chart 3 we see that the NASDAQ had the same EMAs down cross midday Monday and chart 4 shows the Russell 2000 down crossed last Thursday afternoon. It would have been another meaningless sit and wait day for the S&P except that there were very important trades after the close today.
Looking at the top left corner of the cluster above, I have a time and sales log for the SPY showing after hours activity. After the close, there were multiple institutional marker trades that the big Wall Street institutions send out when they have decided it's time for the market to start a new and pronounced move. Team Yellen has been running the show with the two tractor programs for the past three weeks but Wall Street is signalling that it is time for that to end. The trades were a pair of 1.10 mil block trades followed by a pair of 4.50 mil block trades. Several times throughout the years I have brought attention to these same 4.50 mil and 1.10 mil marker trades when they have come through after hours. The Wall Street institutions that send these trades through always have them paired and in these same amounts each time. The reason being is to communicate clearly to the professional and institutional investment communities to be prepared for a big move in the market to begin soon. We finally got both pairs this afternoon and if we look to the Bollinger Bands chart of the SPY with two hour bars just to the right of the log above, we can see that the Bollinger Bands have constricted about as tight as they ever get which happens right before a major break in one direction or the other happens.
The Advance Decline divergence chart in my previous article says the market is about to plummet like a rock, however, Team Yellen's tractor programs have somehow morphed from a rather sloppy narrow trading channel before the end of QE announcement to an incredibly powerful program that keeps the market locked tight in a very narrow channel regardless of any large sell orders coming through when the SPY is at the lower line of this tractor channel. Only one of these two major market forces will have their way if the two are not in sync. It is worthwhile mentioning that these same pairs of 4.50 mil and 1.10 mil marker trades came through the day before the 200 plus point S&P short squeeze started in mid October. Logic now says that these marker trades are Wall Street's signal that the market is about to turn down. However, there is that word, logic. If you have been using logic for your trading in the past month then you probably had your head handed to you in a basket. For those who are not aware, all after hour trades are masked as to whether they are a buy or a sell so you have to figure out whether the marker trades are signalling if the market is about to sell off or start another rally. Yellen's PPT no doubt also saw the marker trades come through and I'm sure they realize that if they are going to start a short squeeze to make the market do what is widely viewed as impossible at this point in the cycle, their window to do so just became very small. The questions now are these marker trades exits or entries and is the market going to break upwards or downwards?
Either way, get ready because Wall Street has officially signaled that they are about to break the market out of these tractor programs with a pronounced move in the market very soon.
