Economic Reports Scorecard
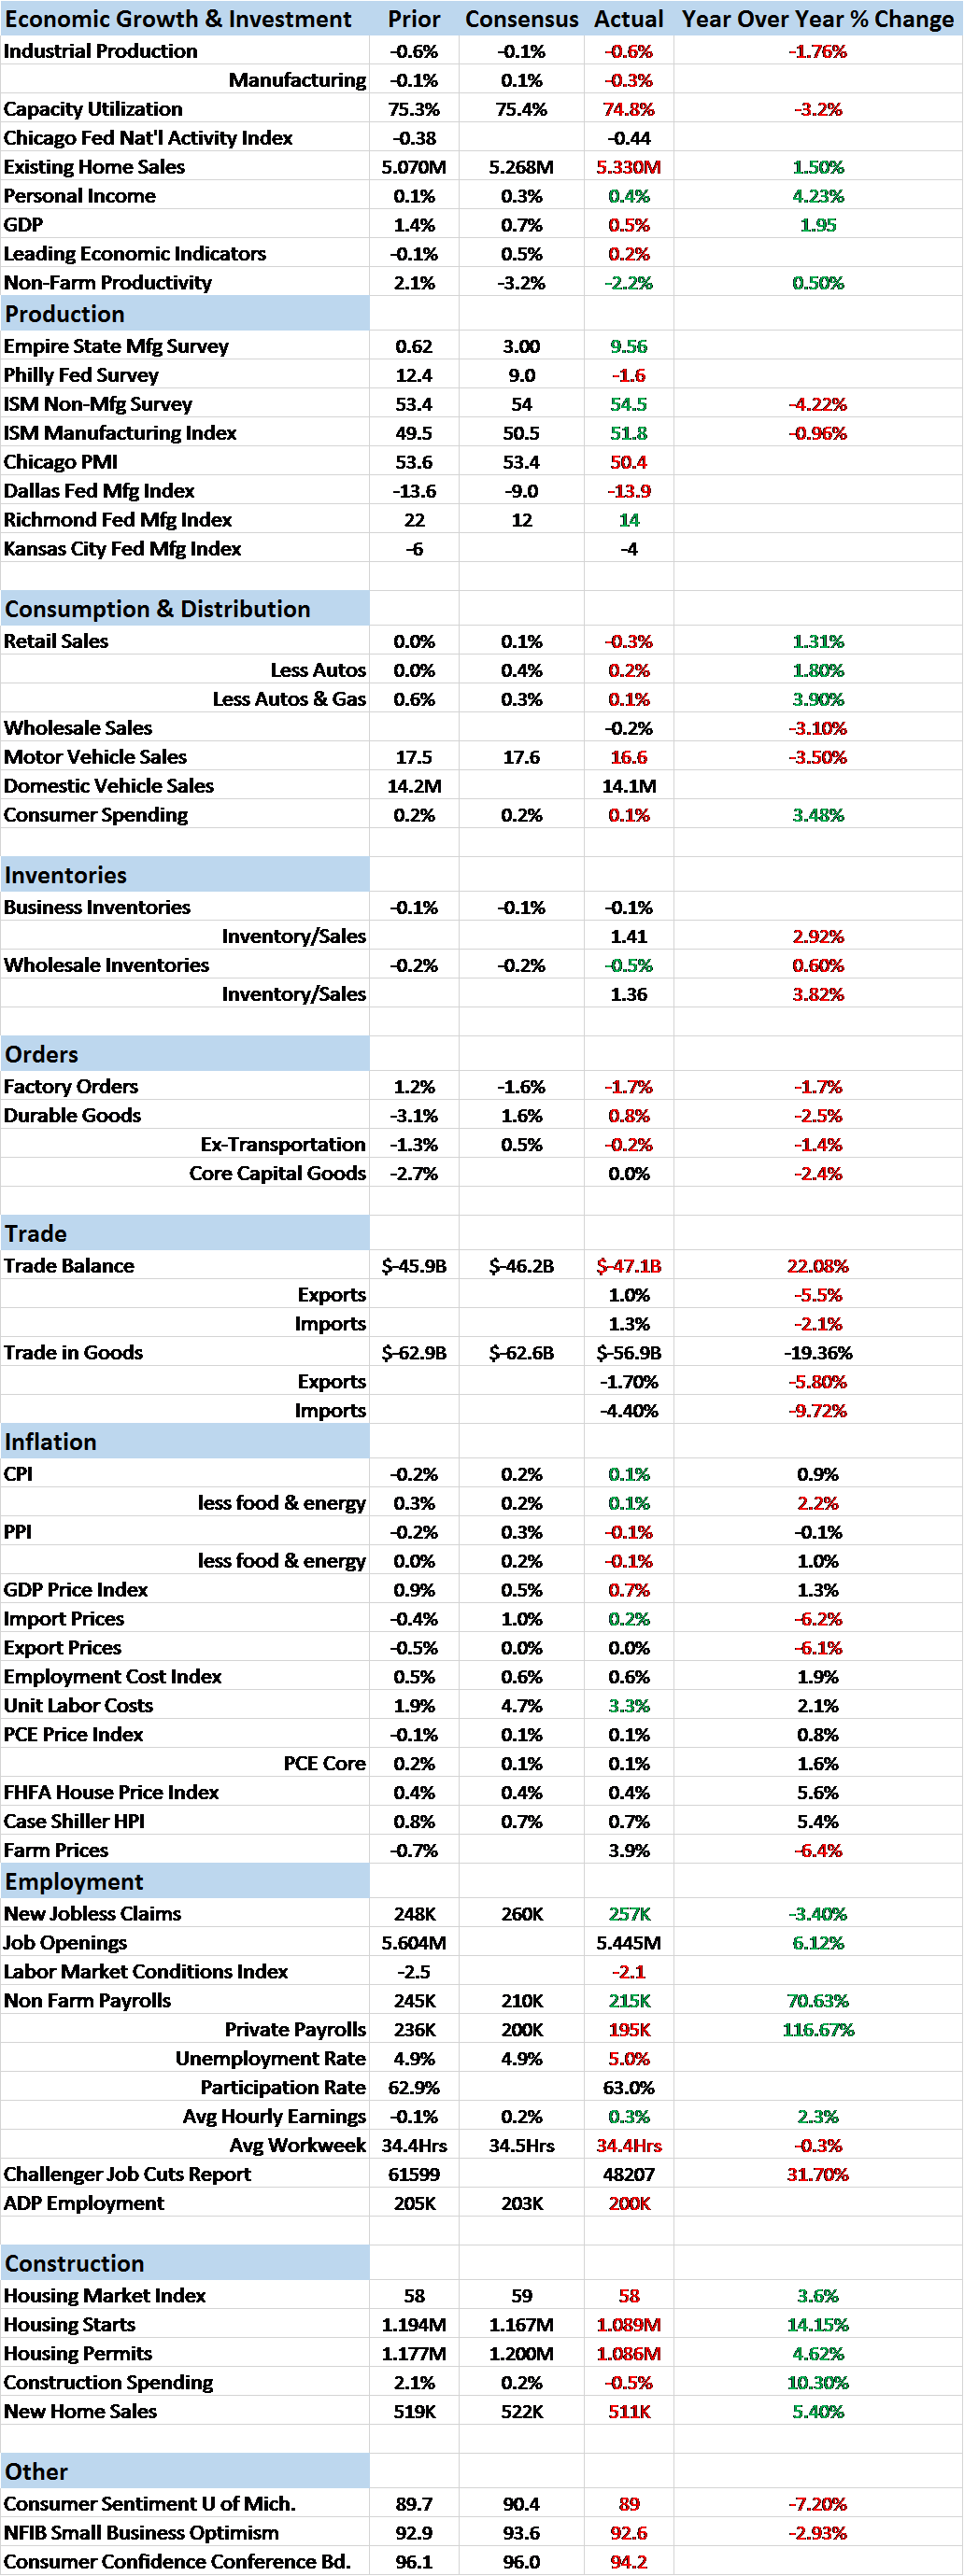
Of the 19 reports released over the last two weeks for which we track a consensus estimate, only four were better than expected. And two of those were the two weekly jobless claims reports. The only other two better than expected reports were the Richmond Fed manufacturing survey and the personal income report. We had a run of better than expected reports a few weeks back but almost all of them were the regional Fed surveys which I tend to discount. And now those appear to be turning back down as the Philly Fed, Chicago PMI and Dallas Fed surveys were all less than expected in the most recent reports. The point is that the data surprises are turning down again, a continuing confirmation of a very weak first quarter.
The GDP report showed growth in Q1 at 0.5%, not unexpected since that was where the Atlanta GDPNow was tracking going into the report, and not very inspiring either. The details of the report make it more concerning than even the punk headline. Consumption kept the number positive, up 1.9% but still down from the previous quarter by 0.5%. More disturbing to me is the make up of that number. Services spending was up 2.7% while durable goods got whacked down by 1.6% due to weakness in autos sales. I would venture to say that the services spending number is being distorted by medical care inflation that is much higher than the GDP deflator. What that means to me is that even positive parts of the report weren’t all that positive.
Residential investment also helped quite a bit, up 14.8% and normally I’d take that as a positive since housing tends to lead other investment. But with housing starts, permits and new home sales all coming in less than expected that may not be true this time. In addition, while all those metrics are still showing year over year gains, the growth rate is definitely slowing.
Non-residential investment was down 5.9% with oil drilling an obvious negative. But equipment and software spending was also down so it wan’t all just a drop in oil drilling activity. The slowdown in investment also shows up in the core capital goods portion of the durable goods report. Those orders are now down 2.4% year over year. That shouldn’t be much of a surprise since investment has been a problem this entire expansion:
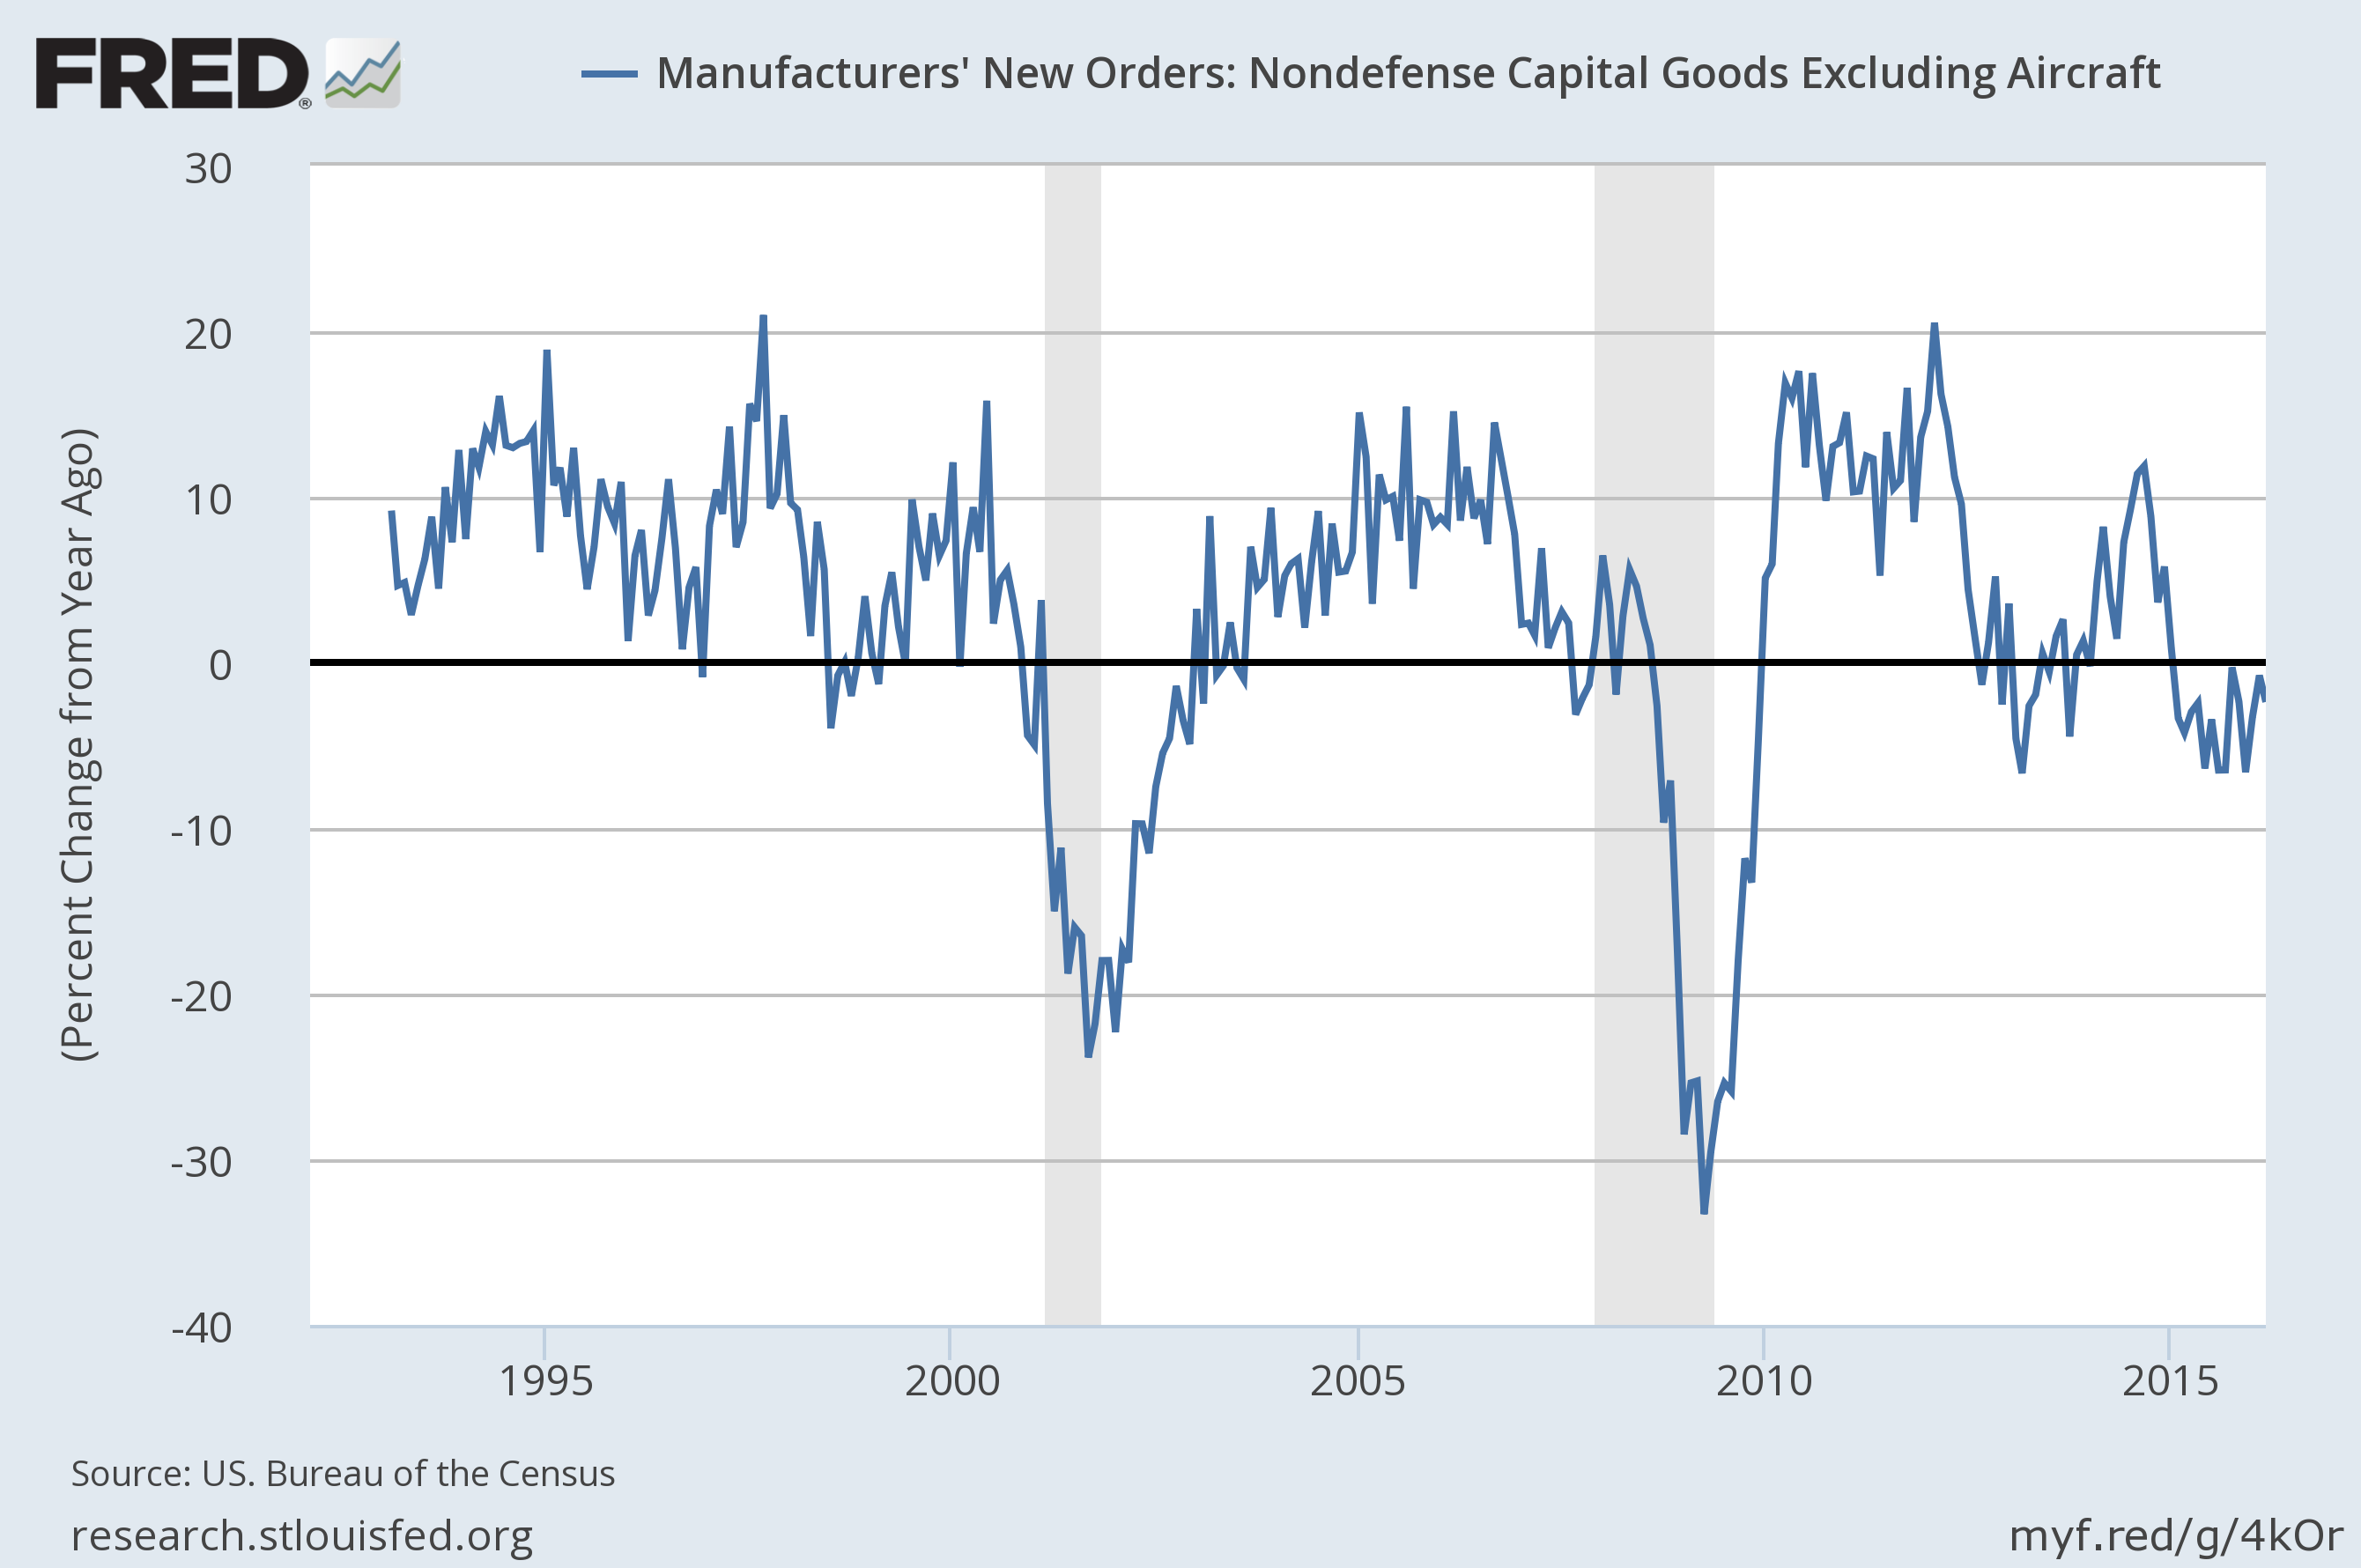
Investment is the source of economic growth over time and while residential investment is welcome it doesn’t move the needle on productivity. I actually tend to think of residential as consumption rather than investment but the government sees things differently. Anyway, I don’t see any reason to expect a surge in investment any time soon. Companies are still being rewarded for dedicating capital to buybacks and dividends so that is what they’ll keep doing, borrowing what they need to for maintenance investment. Companies would have to have some reason to believe that global growth is about to revive in order to ramp up capital spending. Some optimism around emerging markets has recently, er, emerged and the Eurozone may be recovering but both of those are too uncertain to break out the expansion plans.
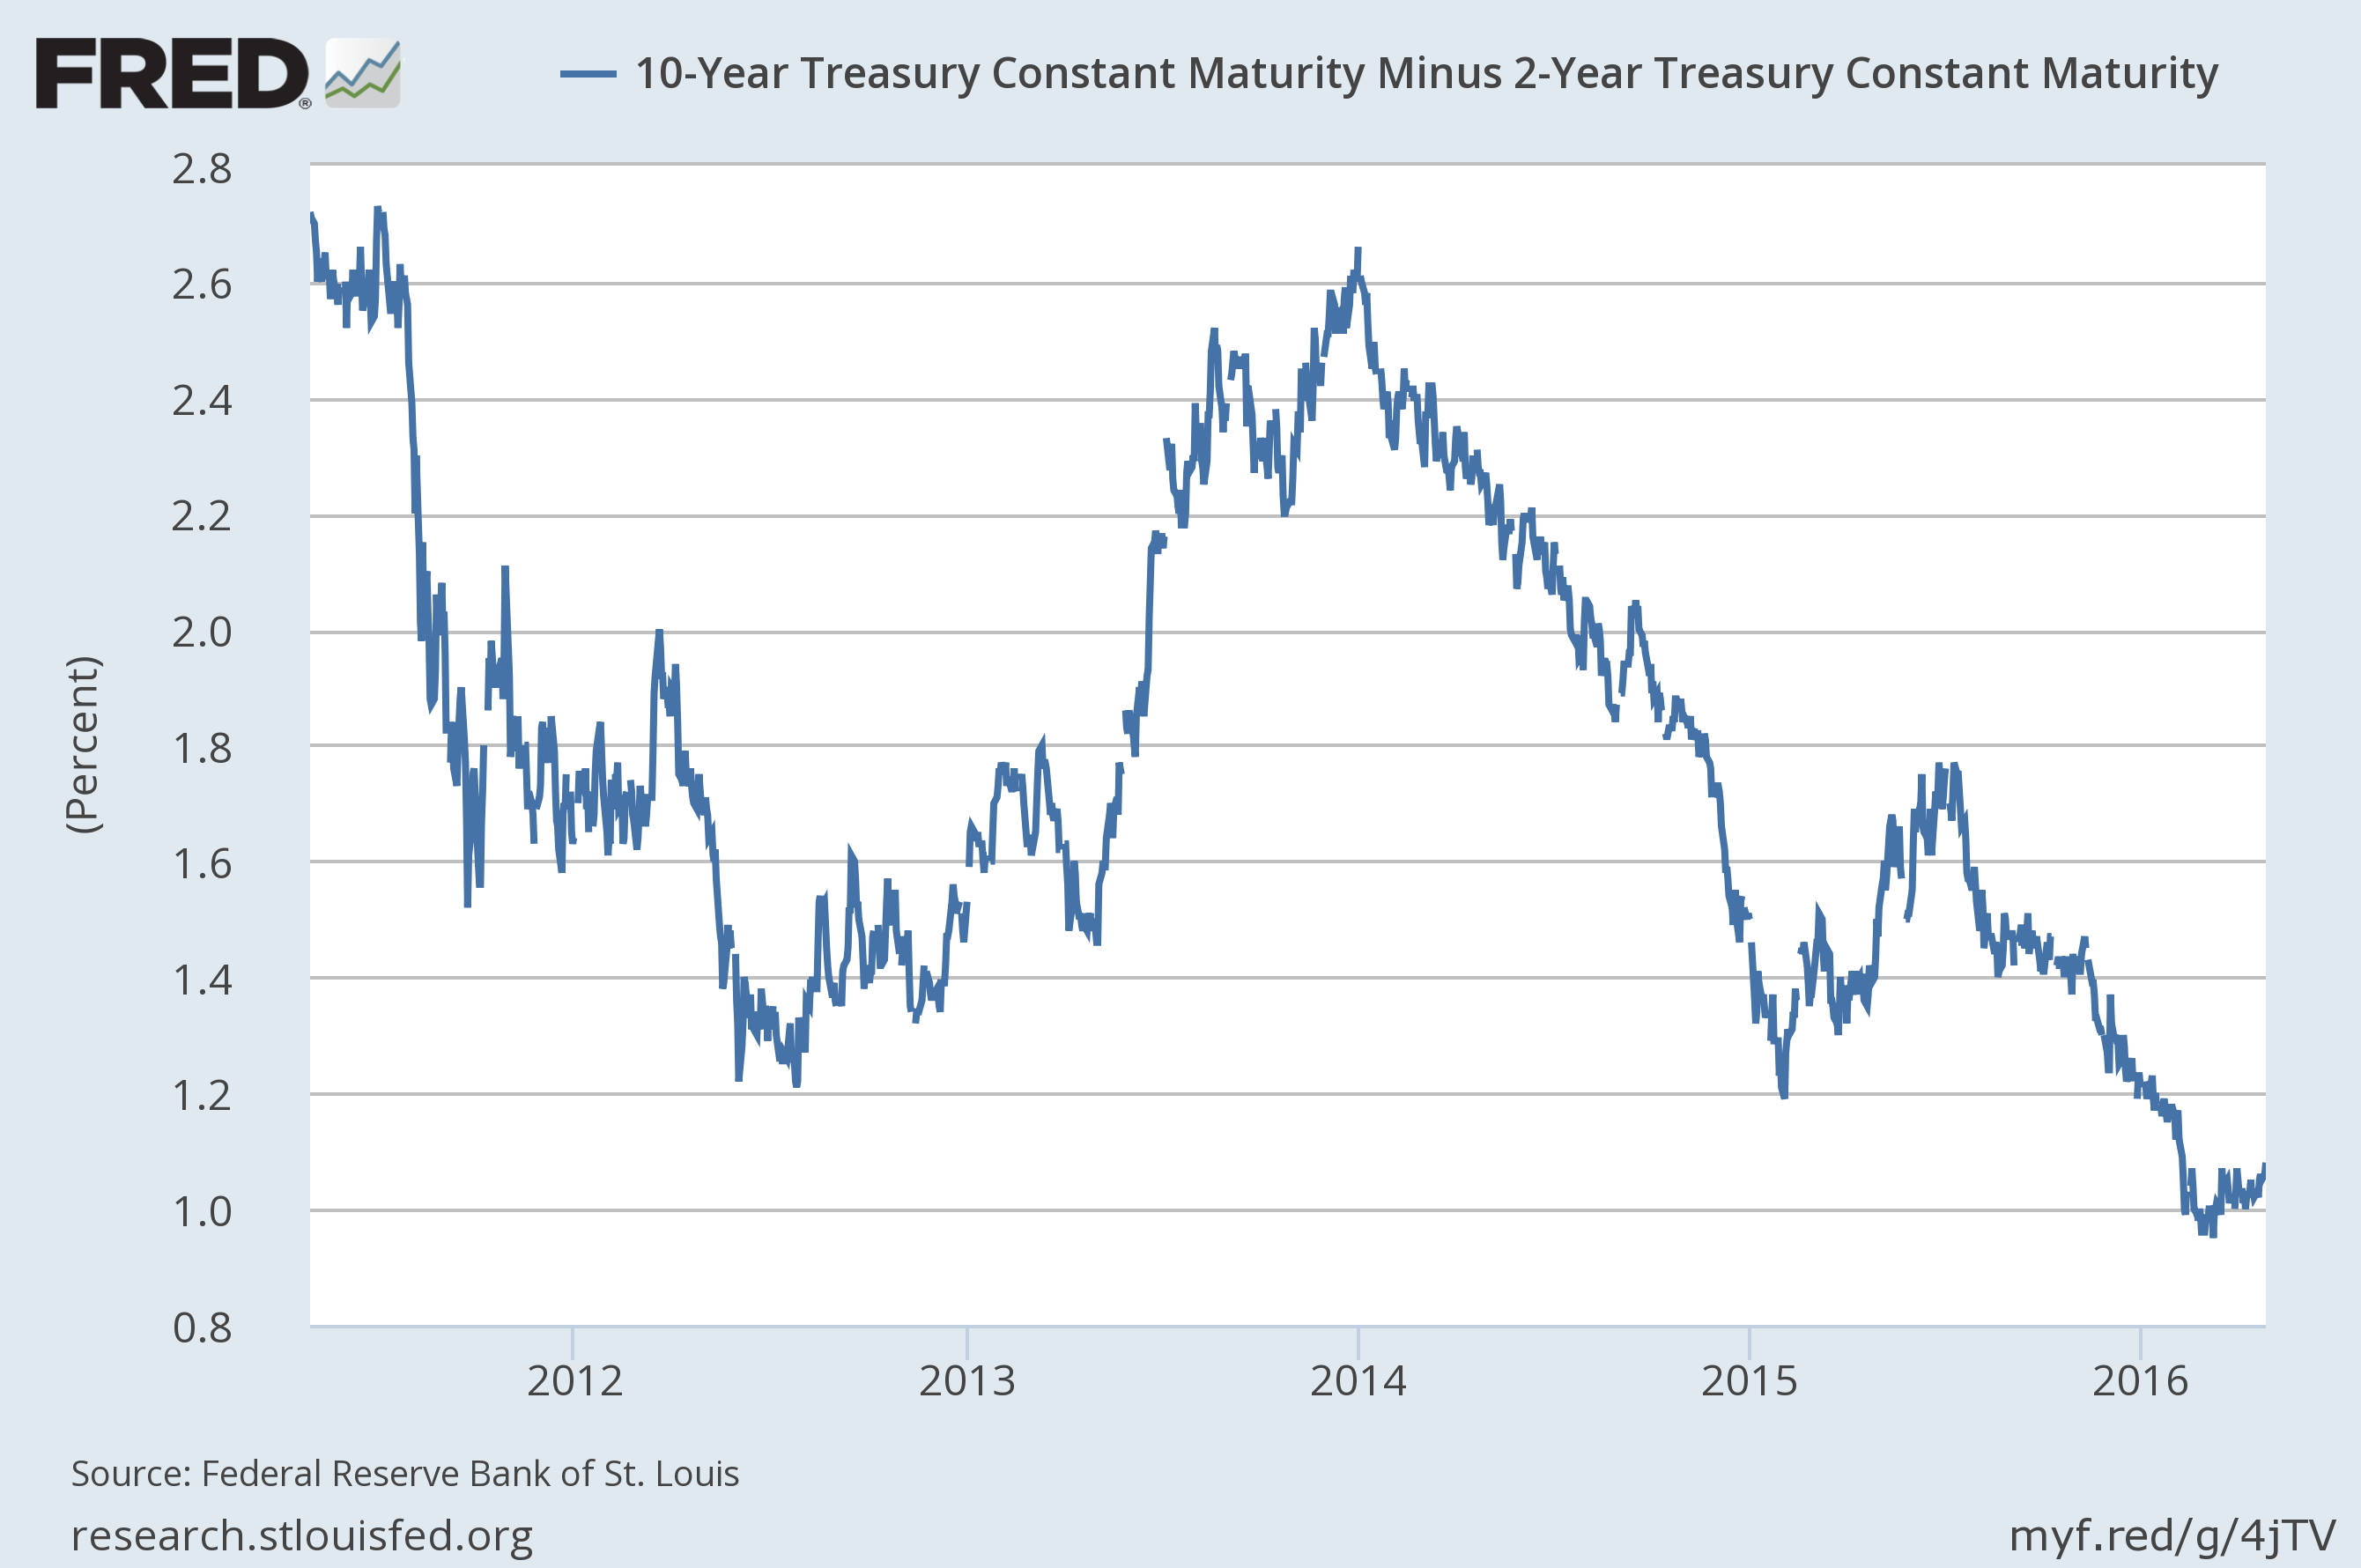
Turning to our market based indicators, the yield curve, as noted in the last update, has stopped flattening. That is purely a reflection of reduced expectations regarding the pace of Fed rate hikes and not a reflection of better real growth expectations. If you still believe that monetary policy can influence real growth I guess that is good news of a sort:
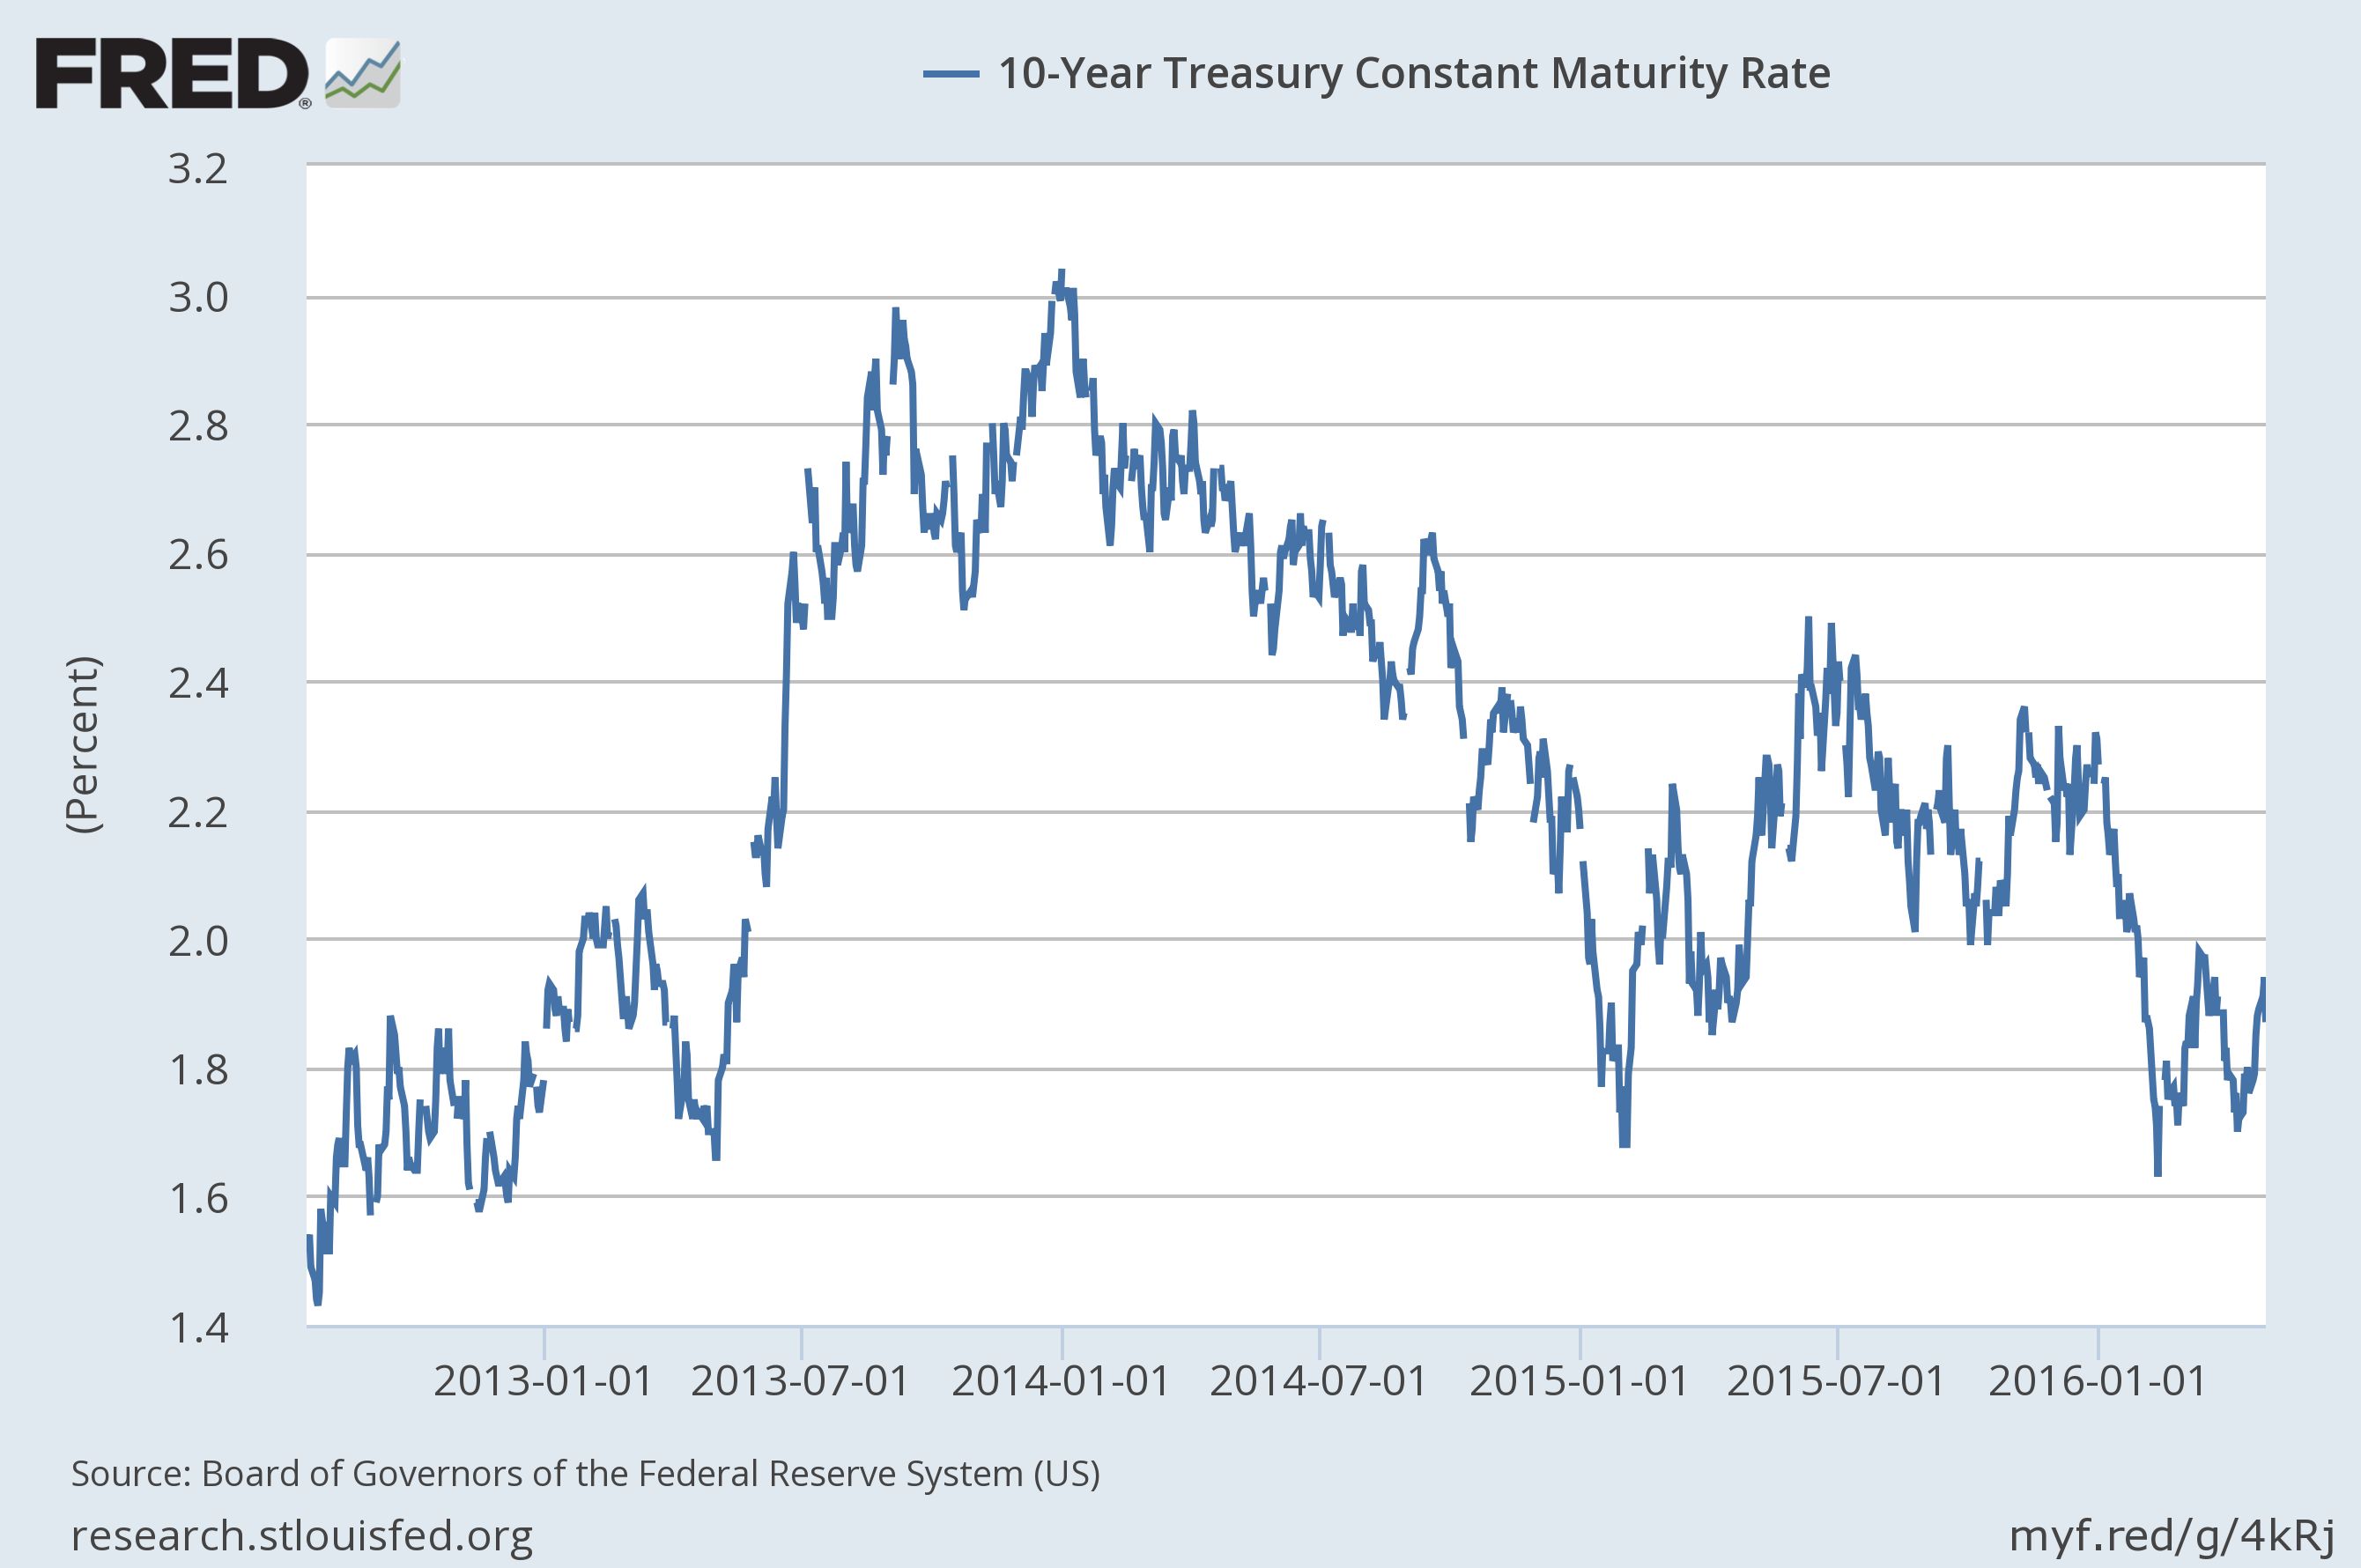
We have seen the 10 year yield tick a bit higher, a reflection of slightly better nominal growth expectations:
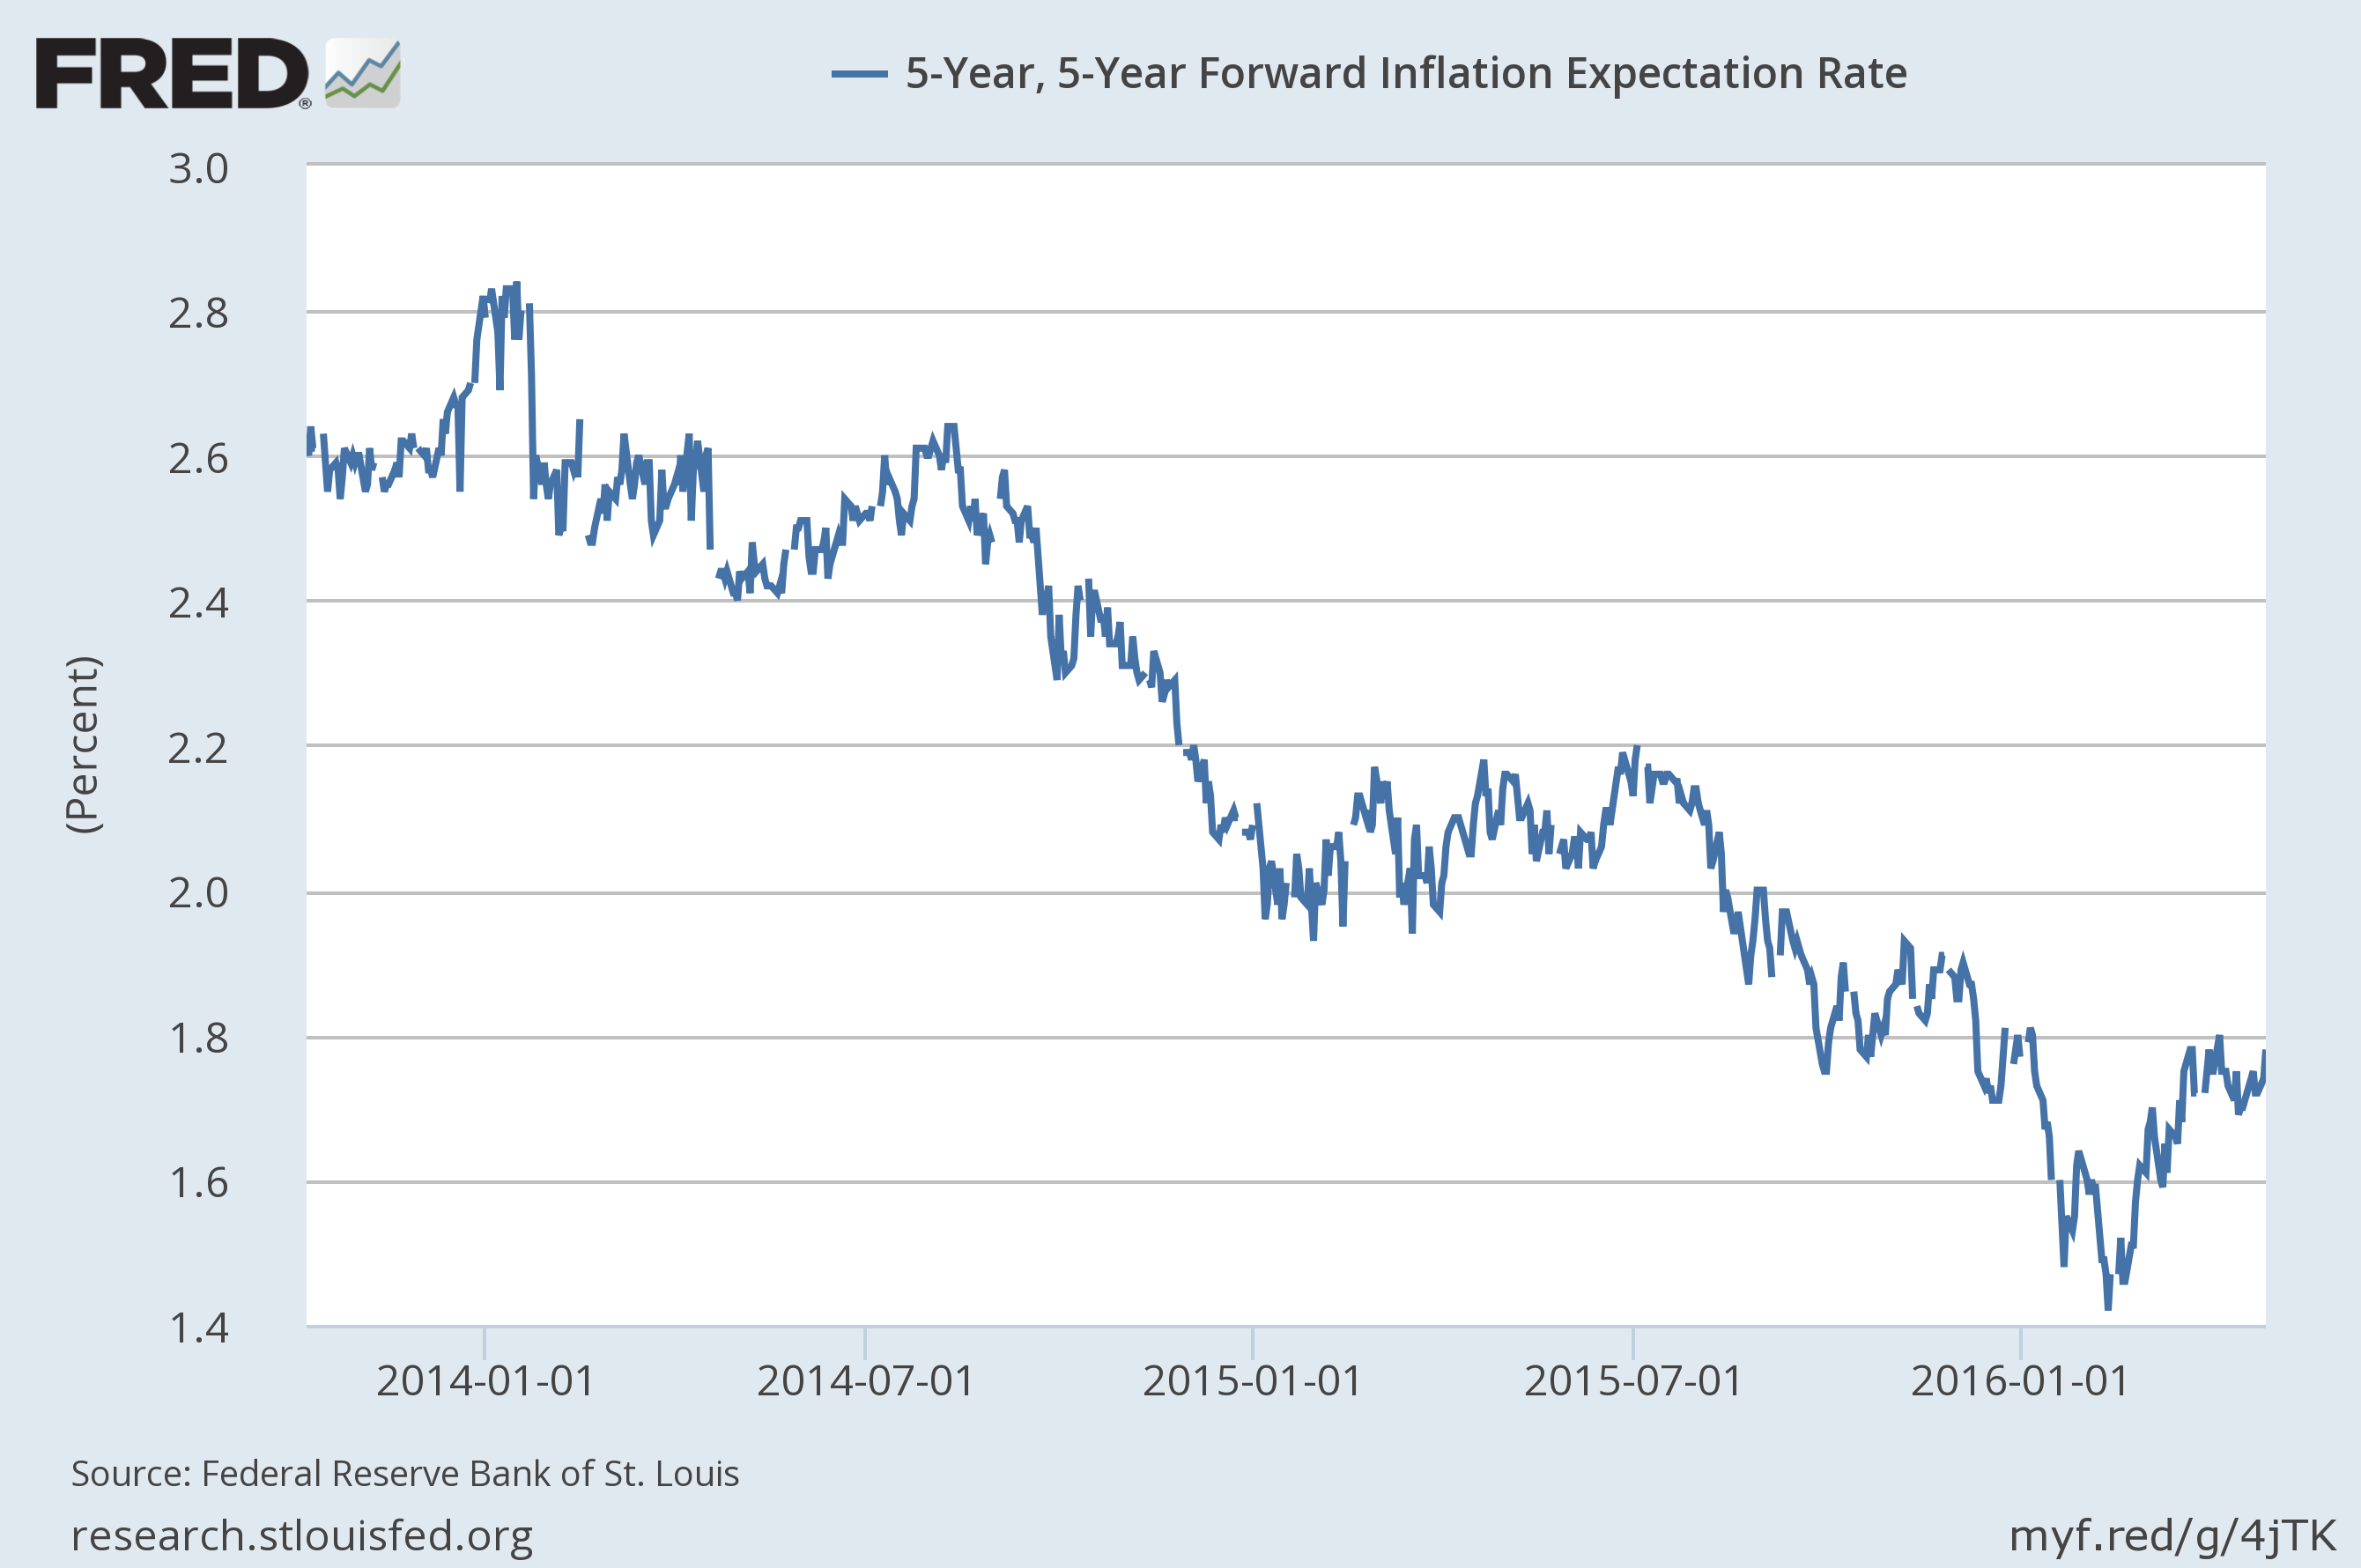
But most of that can be attributed to a rise in inflation expectations, not real growth:
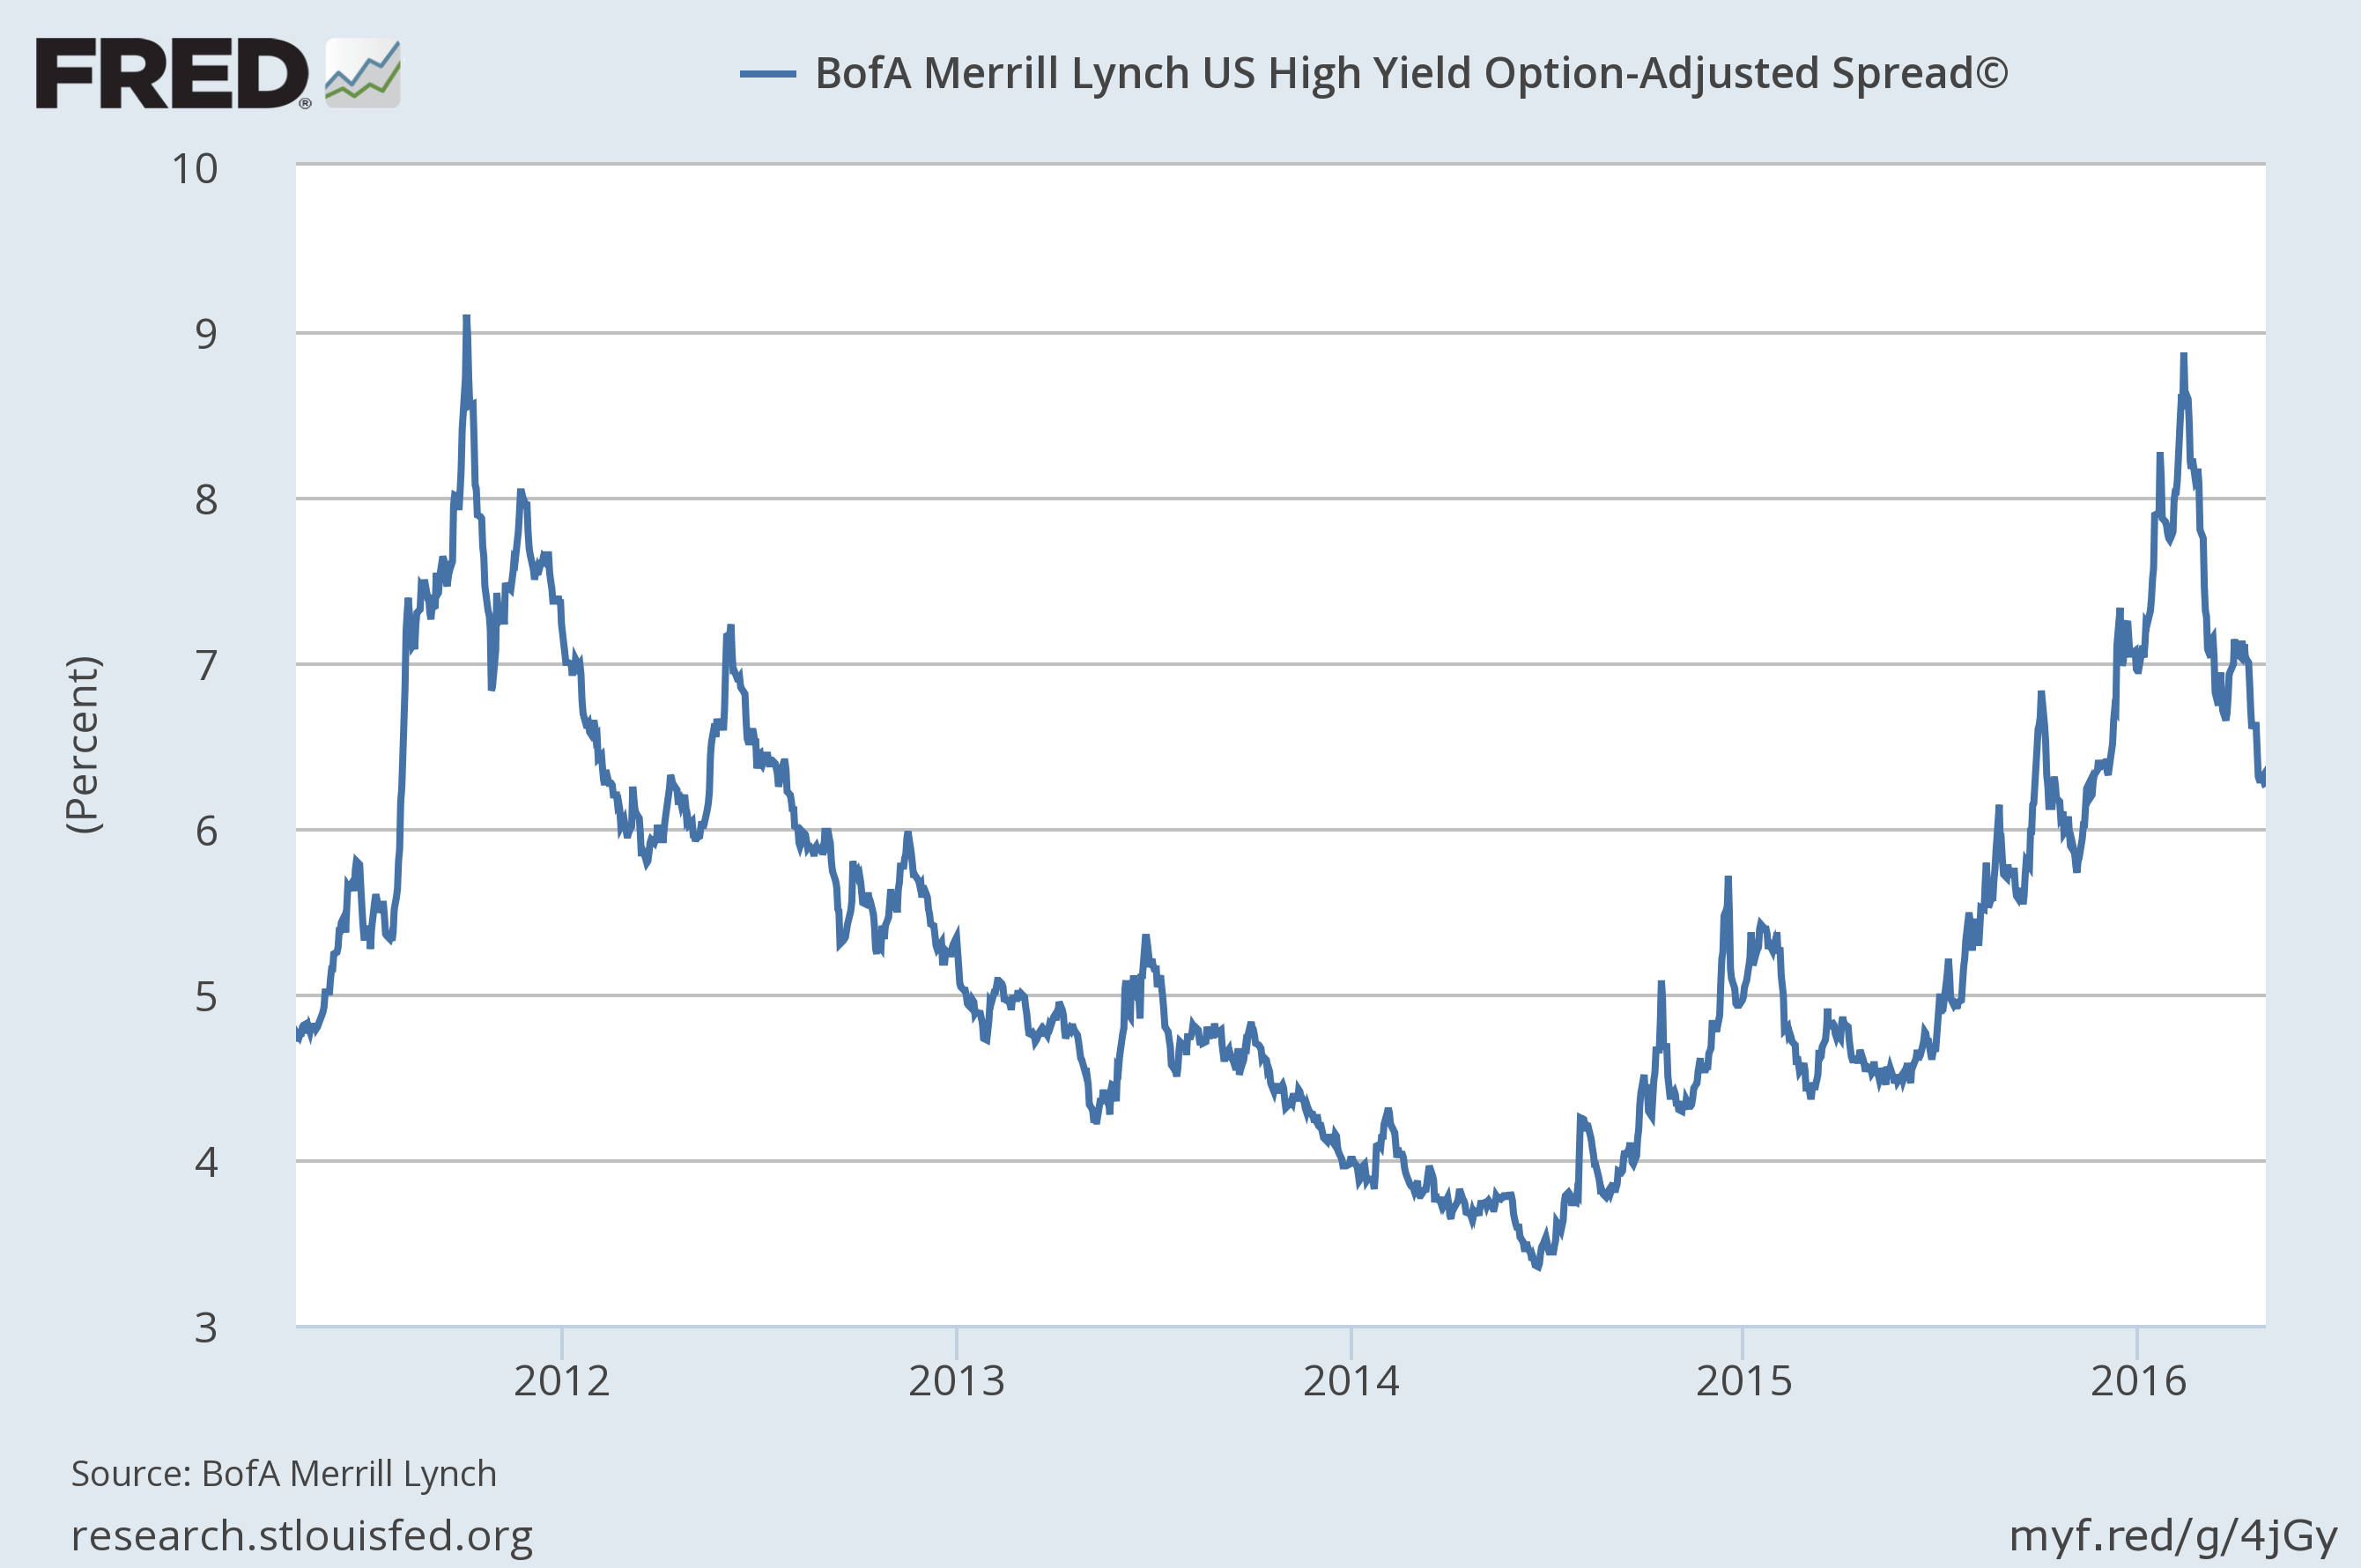
Credit spreads narrowed a bit more since the last update as oil prices continue to rally. I have a Global Asset Allocation update to do next week and our process is to raise our risk allocations when spreads narrow so if I were writing that today, that’s probably what I would do. If you have a process – and boy you better – then you have to stick to it or it isn’t really a process. But I have to say that I don’t trust this junk bond rally or the oil rally that has spurred it for that matter. The supply/demand situation in the crude oil market has not changed that I can tell and the rally is far more than can be justified by the falling dollar.
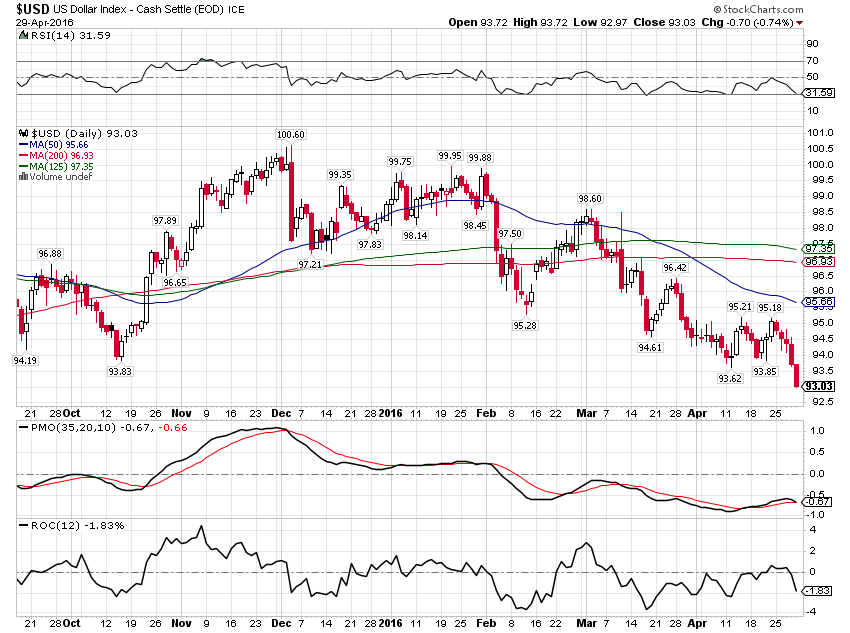
Further evidence of falling US growth expectations are found in the aforementioned falling dollar:
The weak dollar in turn has kept a bid beneath gold, oil and other commodities:
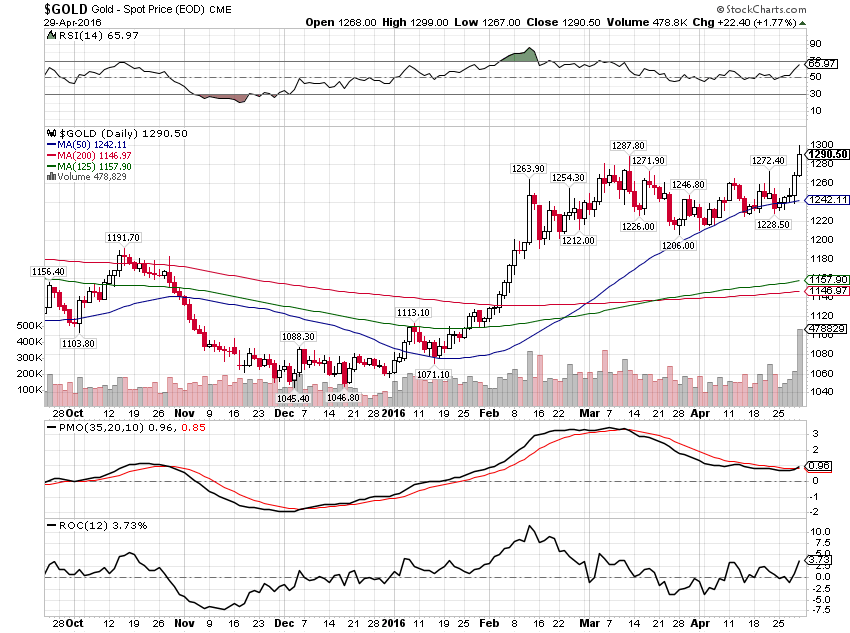
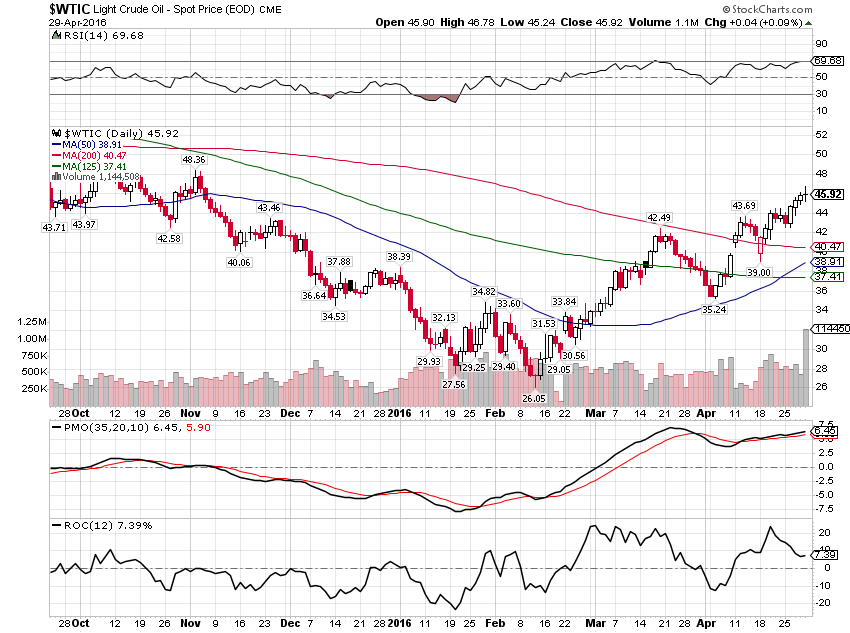
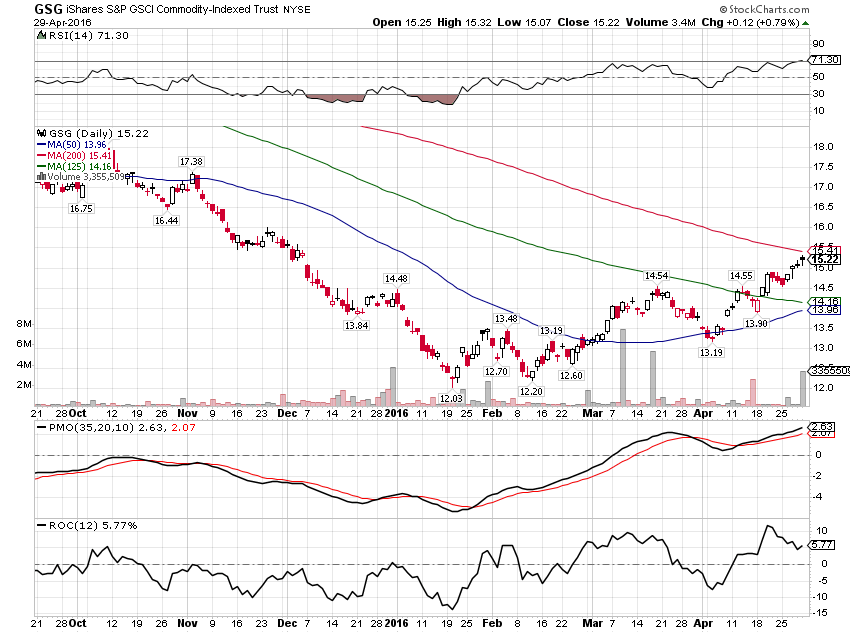
Capital flowing to gold and other commodities – especially gold – is not a positive sign for future US economic growth. The weaker dollar does, however, relieve the pressure on emerging markets and other non-US economies. A best case scenario, from an investor’s standpoint, would be for growth to just shift from US to non-US without triggering a US recession. In general, assets outside the US are quite a bit cheaper than the US but that has been due to fears about growth. To the extent those fears are relieved, those assets should become relatively more attractive. We’ve seen that already as EM stocks have outperformed the S&P 500 for most of this year. A US recession would likely mean a rude interruption of that trend though if history is any guide. It is said that if the US economy catches a cold the rest of the world gets the flu. Too bad there aren’t flu shots for global growth.
