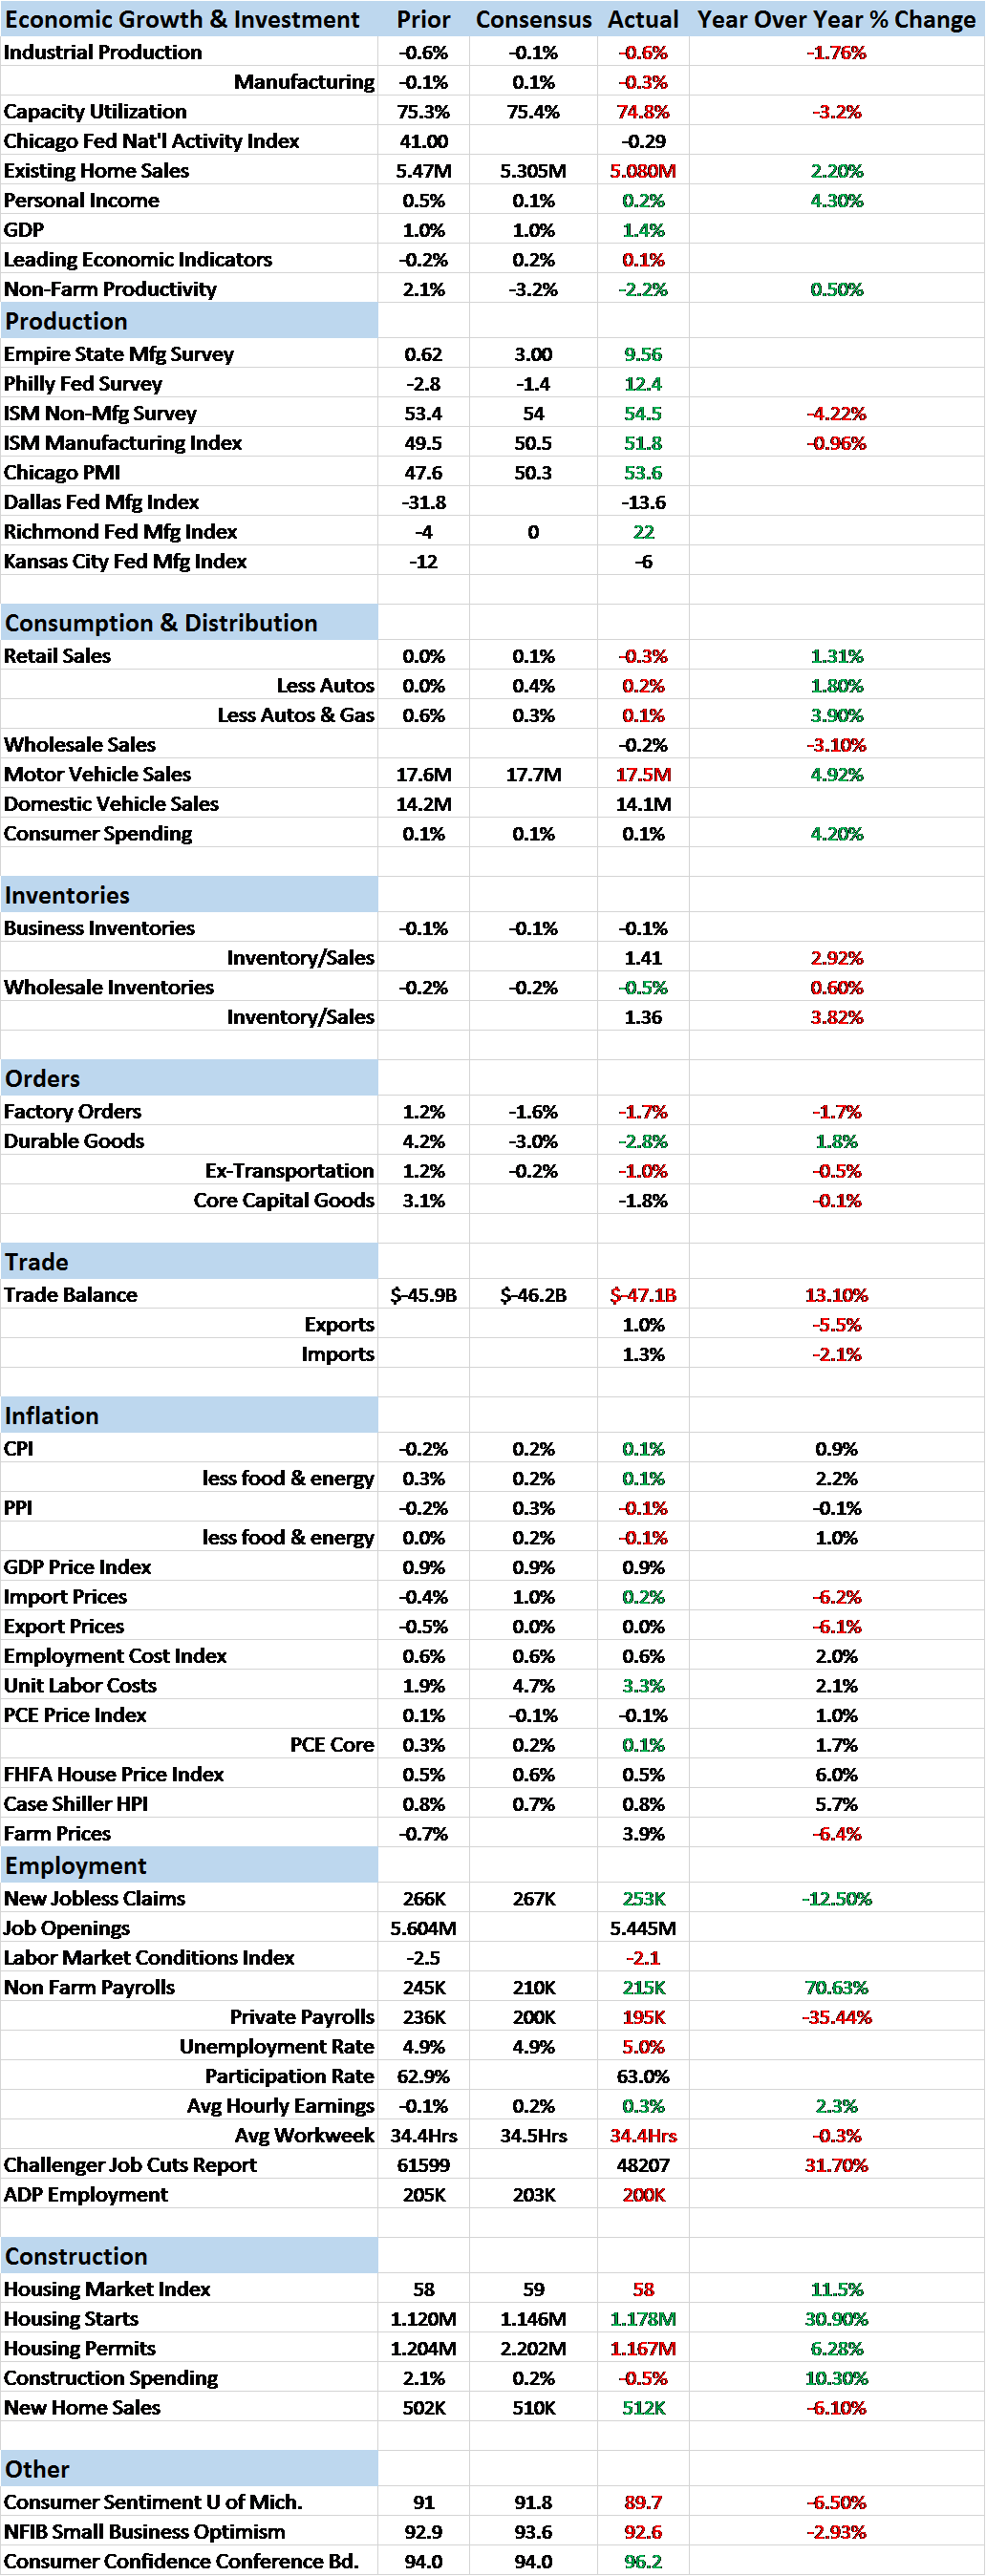
Survey based economic reports continue to run counter to real world, actual data. Since the real data tends to lag, an optimist would probably take this as good news. A pessimist would dismiss it altogether as useless survey based data. Me? I’m a realistic optimist. I see the survey based data as potentially positive since attitude and mood determines to some degree the actions of those taking the surveys. But I will also temper that optimism by waiting for some confirmation before making any bold moves. In other words, trust but verify. We’ve seen these swings to optimism before in this expansion and they’ve been disappointed repeatedly. I’ll hope for the best but not get too excited.
The fact is that the actual data continues to be pretty lousy and not all the surveys are uniformly positive. In particular, the U of Michigan consumer sentiment numbers are deteriorating and the NFIB Small Business Optimism index offers little in the way of its namesake; small business owners must have attended too many Bernie Sanders and Donald Trump rallies and consumed some of the pessimism they’re selling. So, while the regional Fed surveys have definitely improved and the ISM reports were better than expected, those reports almost stand alone in their sunny outlook.
Of course, it could be that those regional surveys will be vindicated by subsequent data but for now, manufacturing remains in the doldrums. Industrial production and capacity utilization were just plain awful last month with auto manufacturing finally reflecting the drop in sales and build in inventories in that industry. Factory orders were down again with the core capital goods component pointing to weakness in investment. The inventory to sales ratio did improve by one tick at the wholesale level but only because inventory fell faster than sales which were down for the 4th straight month. That slight improvement will likely prove ephemeral in any case as retail inventories surged 0.6% against a 0.2% drop in sales keeping the total business inventory to sales ratio unchanged at a still high 1.41. Retail auto inventory to sales is very bloated at 2.14 and rising.
In short, the manufacturing side of the US economy is in recession right now. We aren’t there as a whole yet but the parts that have been holding us aloft are starting to fade. Basically, autos and construction – and I guess services – have been keeping growth in positive territory and autos are fading badly. Construction is still rising year over year but the rate of growth is slowing. I don’t know how we avoid a full blown recession from here but the stock market sure seems to think we’ll pull it off. The rest of the markets aren’t so sure.
The yield curve has stopped flattening, a reflection of the change in expectations for rate hikes. If the curve starts to steepen that will likely be in anticipation of some type of Fed easing but we aren’t there yet. 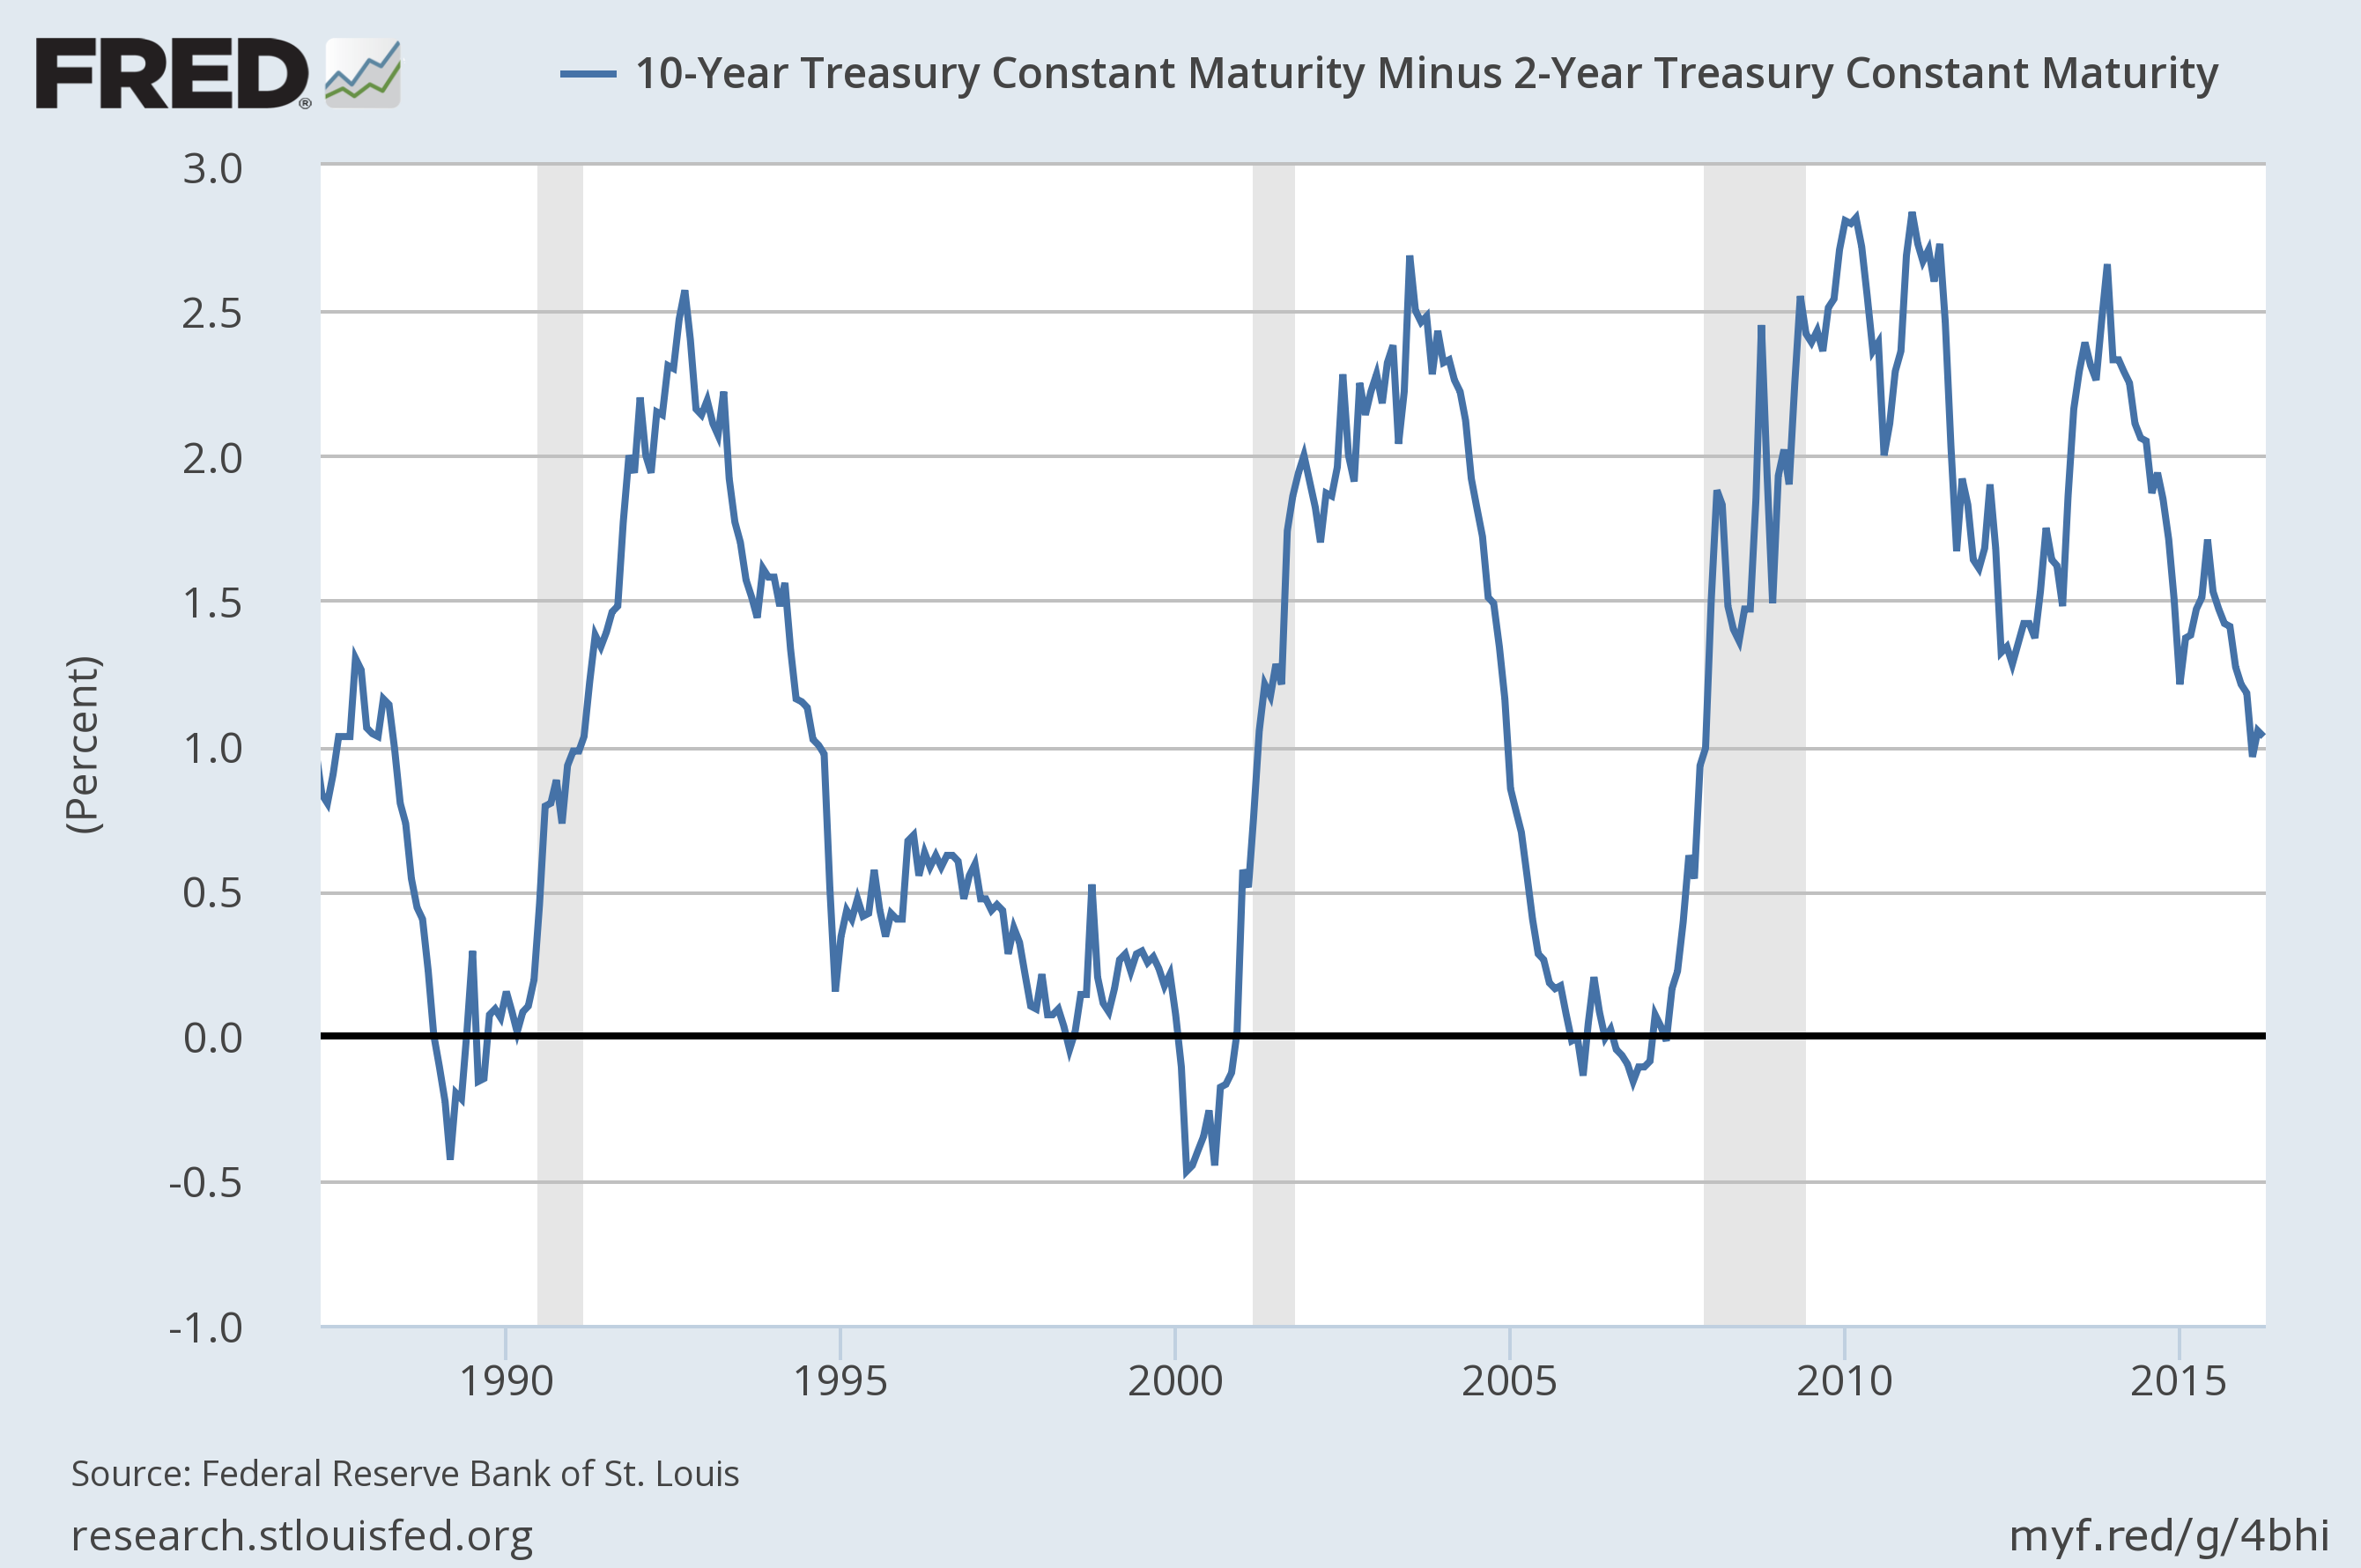
Credit spreads narrowed since the update two weeks ago as risk appetites have been ravenous.
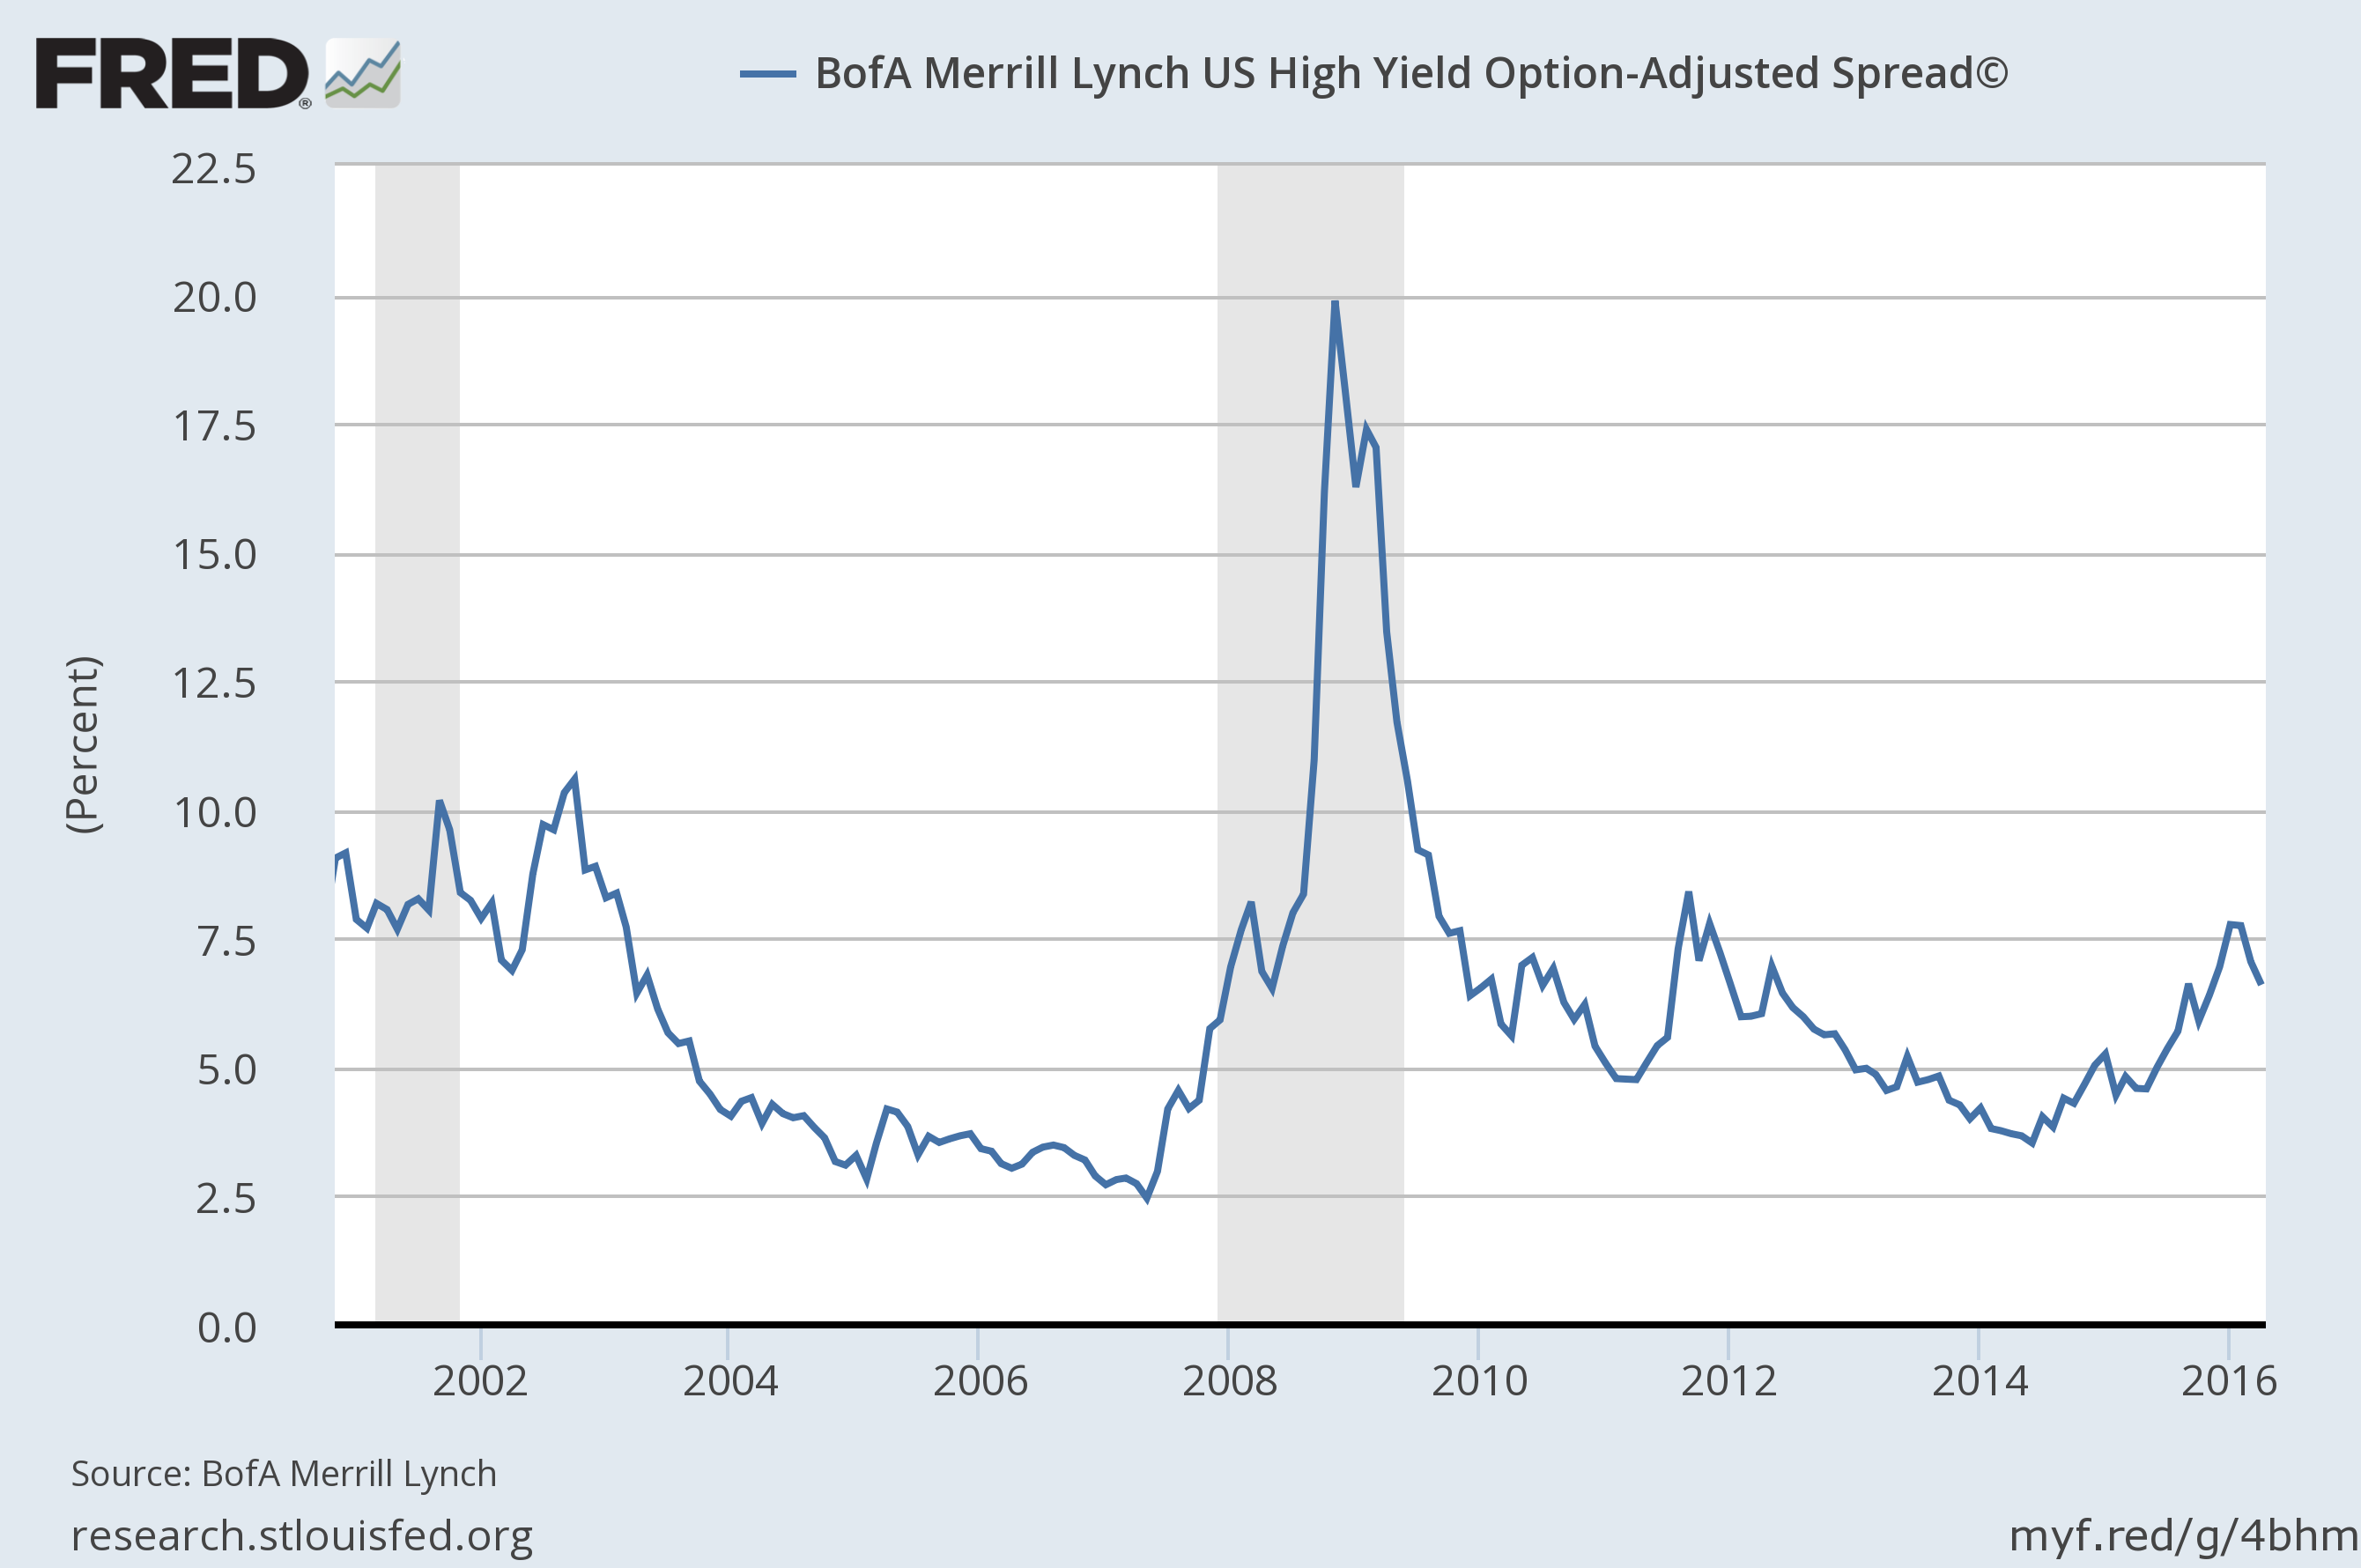
Could investors just push credit spreads down so much that the economic impact is mitigated? I guess so but these three Bloomberg headlines from yesterday seemed incongruous to me:
U.S. April Junk Defaults Reach $14 Billion, Most Since 2014 Soured Corporate Loans Surge at Biggest U.S. Banks on Oil Investors Pour $10.7 Billion Into Junk Bonds as Fears Fade
I’m as contrarian as the next guy – or maybe I’m just contrary – but it seems awfully late in the business cycle to be buying junk bonds to me. If anything, this looks like the beginning of a default cycle, one that will be exacerbated by the poor terms on which money was lent in this cycle. Anyway, I can’t think of a more apt phrase than caveat emptor when it comes to credit right now.
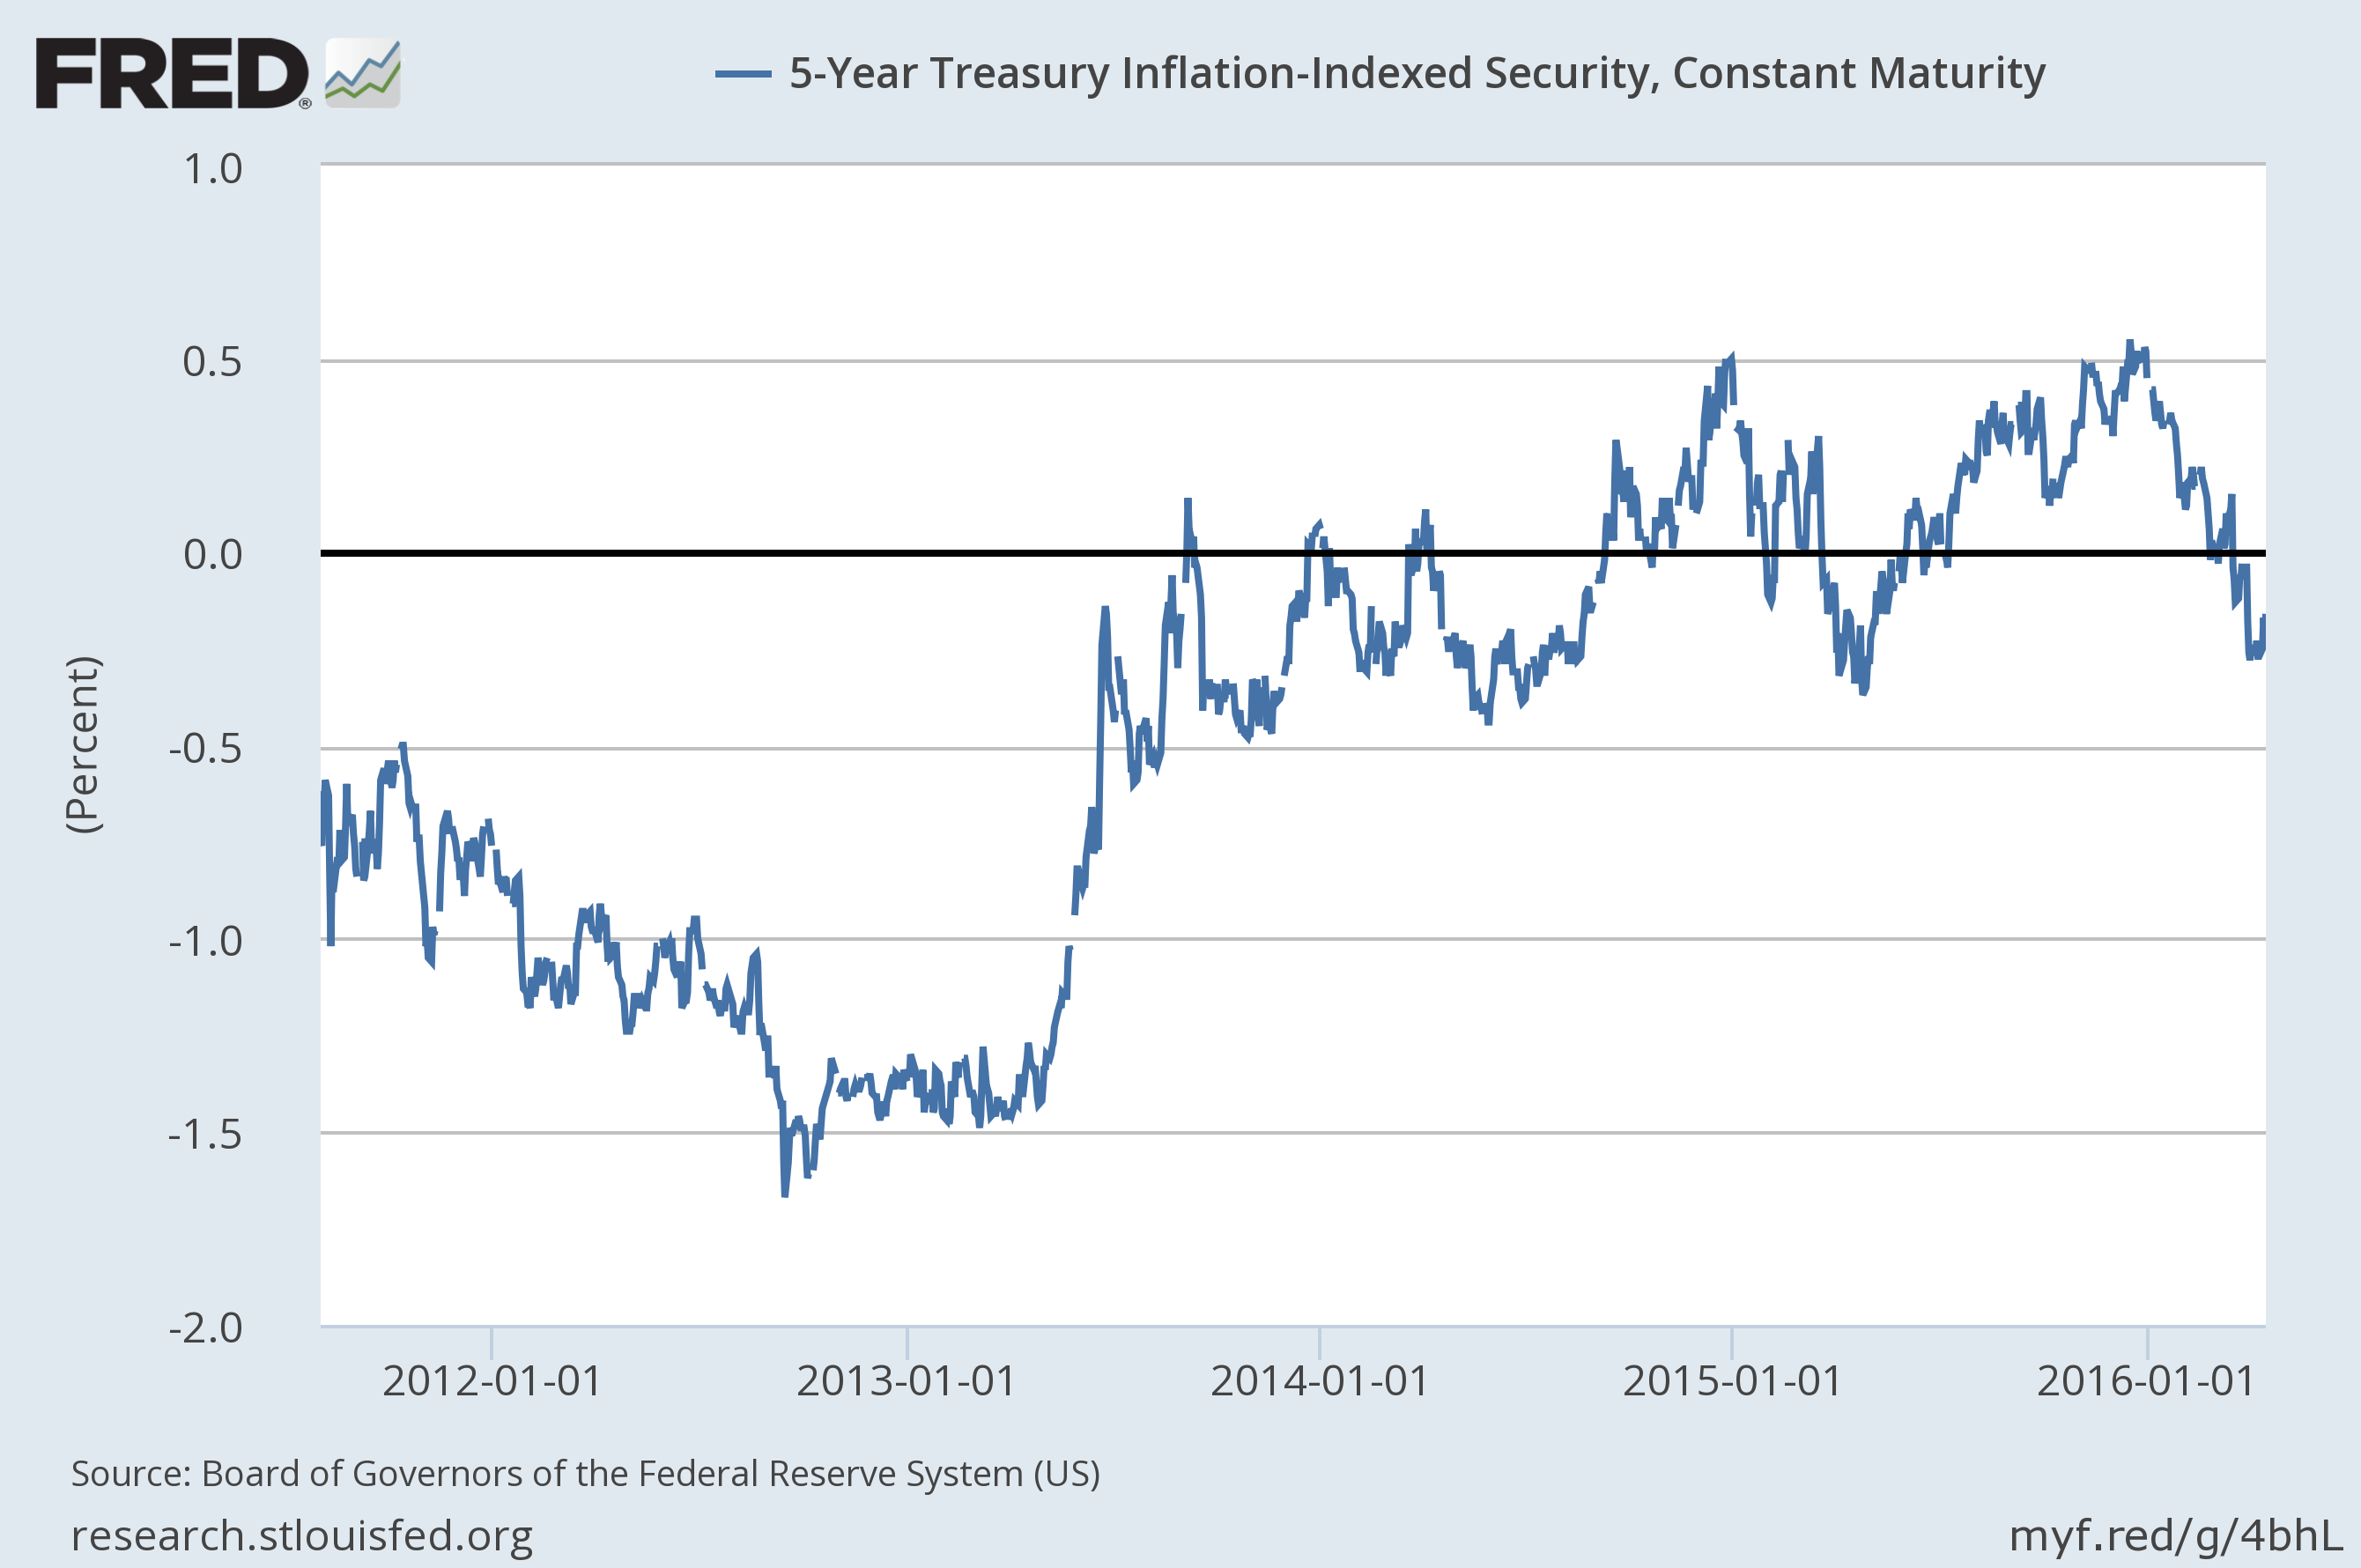
5 year TIPS yields are still negative but did manage to tick up by 9 basis points since the last update. So far that looks like nothing more than a minor bounce but it bears watching. If TIPS yields start to rise, that would be an indication that real growth expectations are rising and might validate the recent move in stocks.
The dollar has made what so far is a feeble attempt at a rally but remains near its recent lows.
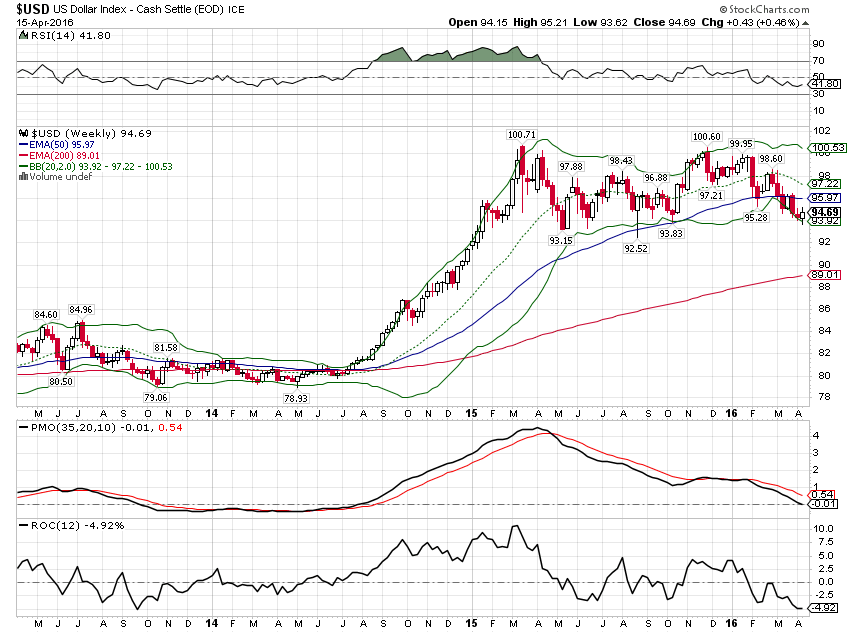
The stalled dollar has the gold and crude oil rallies stalled too:
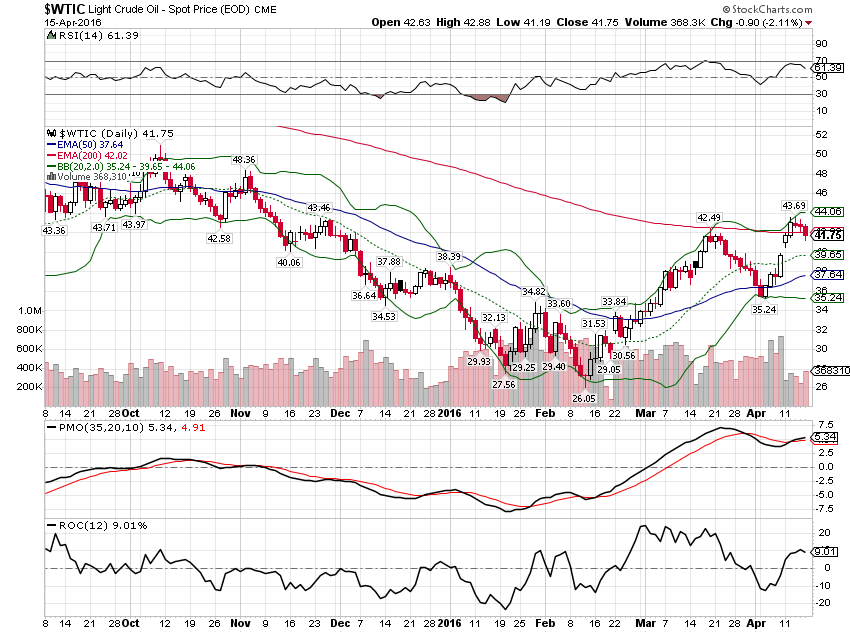
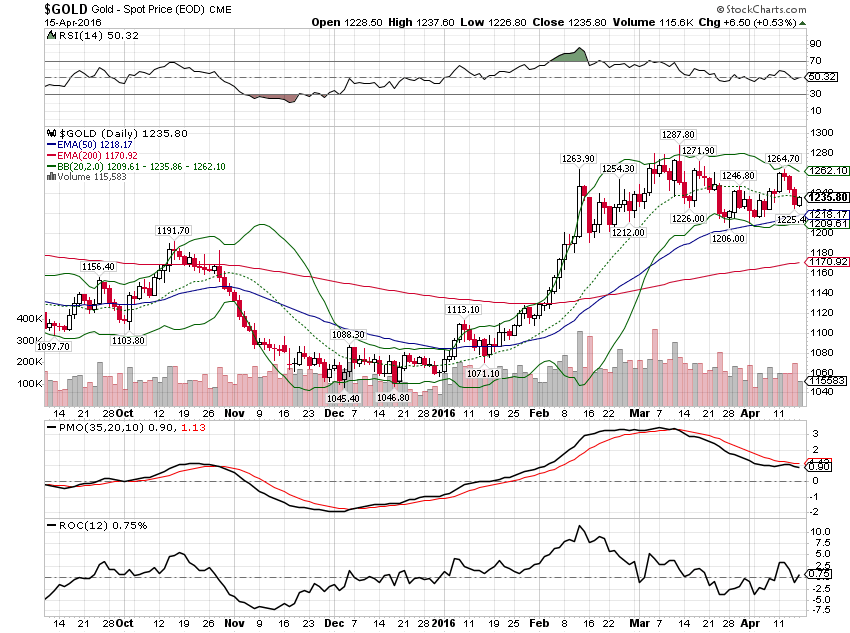
All in all a pretty uneventful two weeks that changes very little. The economic data continues to weaken and markets generally support that thesis. Stocks and junk bonds have certainly shown that risk appetites are hearty but neither of those markets are making new highs. Maybe they will eventually, a self fulfilling prophecy delivered through the wealth effect. Yeah, I’m not holding my breath either. Bond and currency markets sure haven’t confirmed the move in stocks and junk. A 10 year Treasury yielding 1.75%, negative real rates, a dollar down almost 6% from its peak and gold up 17% in a bit over 3 months sure doesn’t sound like the stuff of which booms are made.
