The mid-cap blend style ranks eighth out of the twelve fund styles as detailed in my style roadmap. It gets my Dangerous rating, which is based on aggregation of ratings of 19 ETFs and 279 mutual funds in the mid-cap blend style as of July 19, 2012.
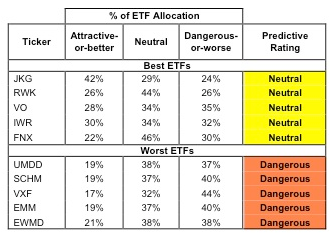
Figures 1 and 2 show the five best and worst-rated ETFs and mutual funds in the style. Not all mid-cap blend style ETFs and mutual funds are created the same. The number of holdings varies widely (from 24 to 3093), which creates drastically different investment implications and ratings. The best ETFs and mutual funds allocate more value to Attractive-or-better-rated stocks than the worst, which allocate too much value to Neutral-or-worse-rated stocks.
To identify the best and avoid the worst ETFs and mutual funds within the mid-cap blend style, investors need a predictive rating based on (1) stocks ratings of the holdings and (2) the all-in expenses of each ETF and mutual fund. Investors need not rely on backward-looking ratings.
Investors should not buy any mid-cap blend ETFs or mutual funds because none get an Attractive-or-better rating. If you must have exposure to this style, you should buy a basket of Attractive-or-better rated stocks and avoid paying undeserved fund fees. Active management has a long history of not paying off.
Figure 1: ETFs with the Best & Worst Ratings – Top 5
* Best ETFs exclude ETFs with less NAV’s less than 100 million.
Sources: New Constructs, LLC and company filings
Four ETFs are excluded from Figure 1 because their total net assets (TNA) are below $100 million and do not meet our liquidity standards.
Figure 2: Mutual Funds with the Best & Worst Ratings – Top 5 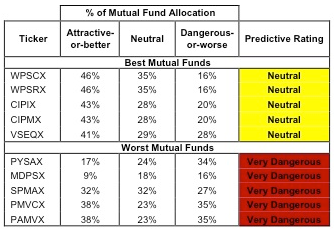
Best mutual funds exclude funds with NAV’s less than 100 million.
Sources: New Constructs, LLC and company filings
14 mutual funds are excluded from Figure 2 because their total net assets (TNA) are below $100 million and do not meet our liquidity standards.
iShares Morningstar Mid Core Index Fund (JKG) is my top-rated mid-cap blend ETF and Westport Funds: Westport Select Cap Fund (WPSCX) is my top-rated mid-cap blend mutual fund. Both earn my Neutral rating.
Rydex S&P MidCap 400 Equal Weight ETF (EWMD) is my worst-rated mid-cap blend ETF and Pacific Advisors Fund Inc: Mid Cap Value Fund (PAMVX) is my worst-rated mid-cap blend mutual fund. EWMD earns my Dangerous rating and PAMVX earns my Very Dangerous rating.
Figure 3 shows that 521 out of the 2513 stocks (over 30% of the total net assets) held by mid-cap blend ETFs and mutual funds get an Attractive-or-better rating. However, there are not any mid-cap blend ETFs or mutual funds that get an Attractive-or-better rating.
The takeaways are: mid-cap blend mutual fund managers pick poor stocks and mid-cap blend ETFs hold poor stocks.
Figure 3: Mid-cap Blend Style Landscape For ETFs, Mutual Funds & Stocks 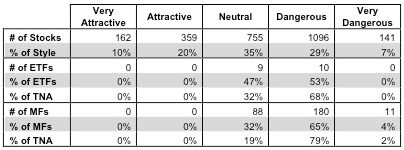
* Ratings distribution of stocks applies only to stocks within our coverage universe.
Sources: New Constructs, LLC and company filings
As detailed in “Cheap Funds Dupe Investors”, the fund industry offers many cheap funds but very few funds with high-quality stocks, or with what I call good portfolio management.
Investors need to tread carefully when considering mid-cap blend ETFs and mutual funds, because all mid-cap blend ETFs are rated either Neutral or Dangerous and 69% of mid-cap blend mutual funds are rated Dangerous-or-worse. If investors want exposure to the mid-cap blend style, they should focus on owning a basket of Attractive-or-better-rated individual stocks, and avoid these Neutral-or-worse-rated ETFs and mutual funds.
Check Point Software Technologies (CHKP) is one of my favorite stocks held by mid-cap blend ETFs and mutual funds and earns my Very Attractive rating. Check Point is one of the leading stars in the network security industry and their steady accumulation of market share has been accompanied by double-digit revenue growth every year since 2007 and widening pre-tax operating margins (NOPBT margin up to over 50% in 2011). There can be no doubt that the operations of the business are profitable and growing. The truest measure of a company’s profitability is its returns on invested capital (ROIC), and this is where CHKP really shines. Checkpoint has nearly doubled its ROIC since 2009, from 44.7% to 89.1%. Consider what those impressive numbers mean: every dollar invested in CHKP’s business generated $0.89 of after-tax operating profits (NOPAT) in 2011. That’s a staggering level of capital efficiency and operating profitability. This is a great company, and right now, it’s a great stock because the market’s current price (~$50.00) implies that CHKP’s profitability growth will screech to a halt and profits will permanently decline by 7%. Unduly low expectations for future cash flows make CHKP a Very Attractive stock.
Accelrys Inc. (ACCL) is one of my least favorite stocks held by mid-cap blend ETFs and mutual funds and earns my Very Dangerous rating. ACCL has consistently eroded shareholder value by earning an ROIC less than its weighted-average cost of capital (WACC). Furthermore, ACCL went on an acquisition spree over 2010-2011, more than doubling the amount of capital invested in the business ($58 million in 2009 to $200 million in 2011). That’s more than $140 million dollars on which ACCL must earn a return higher than its cost of capital. Inorganic growth can signal that the market’s high expectations for growth are starting to catch up with the company. In order to meet the expectations implied by the current market price, ACCL would need to grow its profits by 23% compounded annually for the next 15 years. High expectations for future profits compared to poor past profits make this company’s stock extremely risky.
Figures 4 and 5 show the rating landscape of all mid-cap blend ETFs and mutual funds.
Figure 4: Separating the Best ETFs From the Worst Funds 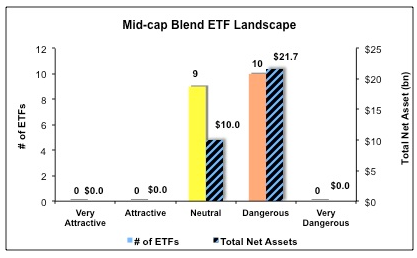
Sources: New Constructs, LLC and company filings
Figure 5: Separating the Best Mutual Funds From the Worst Funds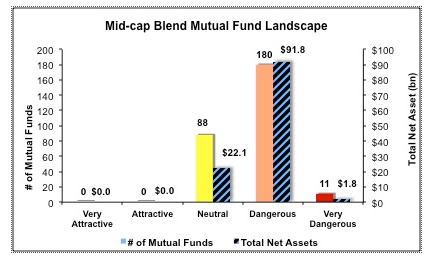
Sources: New Constructs, LLC and company filings
Disclosure: I own CHKP. I receive no compensation to write about any specific stock, sector, style or theme.
- English (UK)
- English (India)
- English (Canada)
- English (Australia)
- English (South Africa)
- English (Philippines)
- English (Nigeria)
- Deutsch
- Español (España)
- Español (México)
- Français
- Italiano
- Nederlands
- Português (Portugal)
- Polski
- Português (Brasil)
- Русский
- Türkçe
- العربية
- Ελληνικά
- Svenska
- Suomi
- עברית
- 日本語
- 한국어
- 简体中文
- 繁體中文
- Bahasa Indonesia
- Bahasa Melayu
- ไทย
- Tiếng Việt
- हिंदी
Best And Worst ETFs (And Mutual Funds): Mid-Cap Blend
Published 07/22/2012, 06:16 AM
Updated 07/09/2023, 06:31 AM
Best And Worst ETFs (And Mutual Funds): Mid-Cap Blend
3rd party Ad. Not an offer or recommendation by Investing.com. See disclosure here or
remove ads
.
Latest comments
Install Our App
Risk Disclosure: Trading in financial instruments and/or cryptocurrencies involves high risks including the risk of losing some, or all, of your investment amount, and may not be suitable for all investors. Prices of cryptocurrencies are extremely volatile and may be affected by external factors such as financial, regulatory or political events. Trading on margin increases the financial risks.
Before deciding to trade in financial instrument or cryptocurrencies you should be fully informed of the risks and costs associated with trading the financial markets, carefully consider your investment objectives, level of experience, and risk appetite, and seek professional advice where needed.
Fusion Media would like to remind you that the data contained in this website is not necessarily real-time nor accurate. The data and prices on the website are not necessarily provided by any market or exchange, but may be provided by market makers, and so prices may not be accurate and may differ from the actual price at any given market, meaning prices are indicative and not appropriate for trading purposes. Fusion Media and any provider of the data contained in this website will not accept liability for any loss or damage as a result of your trading, or your reliance on the information contained within this website.
It is prohibited to use, store, reproduce, display, modify, transmit or distribute the data contained in this website without the explicit prior written permission of Fusion Media and/or the data provider. All intellectual property rights are reserved by the providers and/or the exchange providing the data contained in this website.
Fusion Media may be compensated by the advertisers that appear on the website, based on your interaction with the advertisements or advertisers.
© 2007-2024 - Fusion Media Limited. All Rights Reserved.
