Forex News and Events
Waiting for RBA
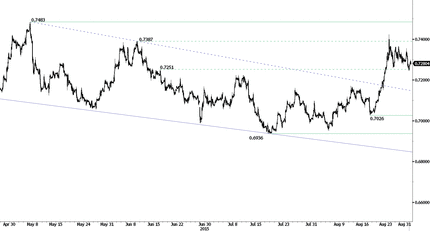
It is well known that Australia is one the world most exposed economy to China as roughly 35% (as of June 15) of Australia’s merchandise exports go to the world’s second biggest economy. The last RBA’s minutes indicated that the central bank was quite confident that the downside risk to the outlook for Chinese growth had abated somewhat. However, at that time the PBoC had not devaluated the yuan, Beijing was still supporting falling equity prices and a September lift-off by the Federal Reserve was almost a done deal.
Now the background is quite different as the uncertainty on global market has reached record heights. We still do not expect a rate cut from the RBA at tomorrow’s meeting since we think that the effects of the recent global market turmoil stemming from China’s growth concerns are still unclear. However, the wording and any comments concerning the effects of the recent developments will be closely monitored, in order to determine whether the RBA reinstates an easing bias.
Fed still supports a rate hike later this year
After the Central Bankers meeting at Jackson-Hole that held last week, comments from Fed’s official were closely watched by traders. They indicated that stock market volatility and China’s turmoil did not change their outlook on the U.S. Economy and therefore they were still seeing improvement in the U.S job market. Furthermore, the Fed confirmed that rates will be hiked when there will be reasonable confidence that the inflation rate will rise again to 2%.
Last week, the most important topic was not about some Fed’s officials talking of how much their U.S. monetary policy is in full control of the U.S. economic stability. It was more about China dumping U.S. Treasury Bonds. This has been done after the debasement of the Chinese currency. And last but not least U.S. needs to buy back its own treasury bonds. QE4 may be of a good help.
After several years of quantitative easing, U.S is not on a clear recovery path. Also, the biggest world economy is way too sensitive to regional turmoil as what is happening in China. No rate hike will happen in September and we remain bearish on the dollar as we consider that the Fed is now in a difficult position as we think that the outlook is likely to change from a rate hike to a new quantitative easing.
Fed trapped?
Who’s really in control? According to the headlines Federal Reserve officials seem to be holding firm on strategy to raise rates by years end despite market volatility. In Jackson Hole Wyoming, Fed Vice Chairman Stanley Fischer stated, “There is good reason to believe that inflation will move higher as the forces holding inflation down—oil prices and import prices, particularly—dissipate further.” While he did not commit to a September 17th rate hike its looks as if the recent financial instability has not discouraged FOMC members. However, gauging by Fed Fund futures and US yields the markets are steady discounting the probability of a rate hike this years. Fed Funds futures implied rate for September 17th indicates a 38% probability of a rate hike and December 16th 59%. Much of the uncertainty is derived from recent volatility in financial markets. Subsequent markets reactions to Fischer’s comments was in increased risk-off sentiment with Shanghai Composite falling 0.82% (down 12% down for the month) and US stock futures pointing to a weaker open. Clearly, while the Fed would like to push forward with a rate hike, nevertheless, just the suggestion generates markets disturbances, and therefore decreases the likelihood of tighter policy. Its uncertain, that given this action-and-reaction cycle, the Fed will be able to raise rate without generating significant markets turmoil. As some point either the Fed embrace the resulting volatility or come to grips with zero rates well into 2016.
Good Swiss Data Sell CHF
In a surprise read, Swiss KoF August leading Indicator barometer rose to 100.7 from 100.4 (100.3 expected read). However, for the past 5-years KoF leading indicator has been volatile and not a solid indication of Swiss GDP growth. Therefore due to other incoming economic indicators, we remain negative on the Swiss economic outlook and with that bearish on the CHF. Swiss growth and inflation outlook is weak and the SNB will keep policy loose, encourage traders to utilize the CHF as a funding currency for carry trades. In fact this weekend the SNB President Jordon reiterated the central bank’s commitment of loose policy and defending the CHF from appreciation. Over the weekend, Jordon stated that “we’ll have to live a certain time with negative rates”. In addition, he provided the usual corporate line that the CHF was overvalued and SNB willing to wage foreign currency intervention. While some apprehension exist over the reliability of SNB comments after the abrupt abandonment of the EUR/CHF “floor”, markets are slowly rebuilding a new “SNB put” position.


The Risk Today
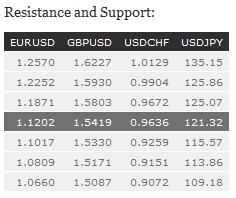
EUR/USD has shifted into a consolidation pattern. Over the last month, the pair is setting higher highs. Hourly resistance lies at 1.1714 (24/08/2015 high). Hourly support can be found at 1.1203 (27/08/2015 low). In the longer term, the symmetrical triangle from 2010-2014 favored further weakness towards parity. As a result, we view the recent sideways moves as a pause in an underlying declining trend. Key supports can be found at 1.0504 (21/03/2003 low) and 1.0000 (psychological support). We have broken the resistance at 1.1534 (03/02/2015 reaction high). We are entering an upside momentum.
GBP/USD has broken hourly support at 1.5425 (07/08/2015 low). Hourly resistance is given at 1.5930 (18/06/2015 high). We now target hourly support at 1.5330 (08/07/2015). In the longer term, the technical structure looks like a recovery bottom whose maximum upside potential is given by the strong resistance at 1.6189 (Fibo 61% entrancement).
USD/JPY is still holding above the 200-day moving average. Support is given at 115.57 (16/12/2014 low) which is also a long term support. Stronger support can be found at 113.86 (10/11/2014 low). A long-term bullish bias is favored as long as the strong support at 115.57 (16/12/2014 low) holds. A gradual rise towards the major resistance at 135.15 (01/02/2002 high) is favored. A key support can be found at 118.18 (16/02/2015 low).
USD/CHF has broken hourly resistance at 0.9588 (21/08/2015 low). Hourly support is given at 0.9151 (18/06/2015 low). The pair is likely to consolidate above 0.9600. In the long-term, the pair has broken resistance at 0.9448 suggesting the end of the downtrend. This reinstates the bullish trend. Key support can be found 0.8986 (30/01/2015 low).

