T2108 Status: 60.2%
T2107 Status: 61.6%
VIX Status: 13.4
General (Short-term) Trading Call: cautiously bullish
Active T2108 periods: Day #73 over 20%, Day #72 over 30%, Day #69 over 40%, Day #3 over 50%, Day #2 over 60% (ending 9 days under 60%)(overperiod), Day #18 under 70% (underperiod)
Commentary
The market wasted no time in forcing my triggers to flip to a bullish short-term trading bias. The breakouts from Tuesday, May 24th were quickly followed by more buying. The follow-through confirms that buyers have pushed sellers aside and are now potentially positioning for a fresh extended run.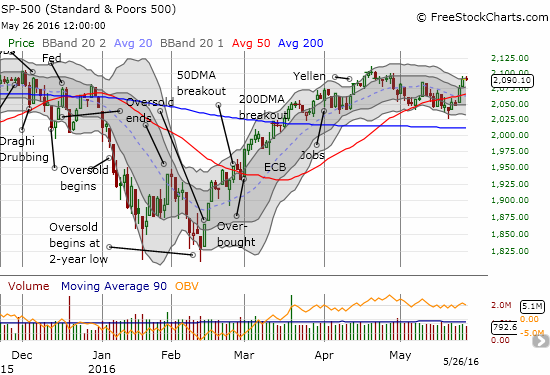
The S&P 500 (SPDR S&P 500 (NYSE:SPY)) has not quite made a new high for the year, but this breakout and follow-through are still bullish.
My trading call is cautiously bullish since the S&P 500 (SPY) has not yet broken through presumed resistance from 2016’s high and then the all-time high set a year ago. The bullish conversion will be complete if (once?) T2108 flips back to overbought territory. I will consider the bearish case if T2108 fails at or near the boundary of overbought conditions (70%). A close below the 50DMA is also bearish. In other words the risk of whiplash is very real and on-going. The index is working inside tight spaces.
T2108 confirmed the follow-through on the S&P 500. On Wednesday, May 25th it closed at 60.5%. Thursday it closed a hair off at 60.2%. T2107, the percentage of stocks trading above their 200DMAs, is even MORE bullish. T2107 closed at 61.6%, just a hair away from a new 20-month high.
With all this bullishness, it goes without saying that the volatility index, the VIX, is back to the bottom of its recent range. I also have to make my standard observation that the VIX has historically bounced from these levels (low volatility begets high volatility and vice versa).
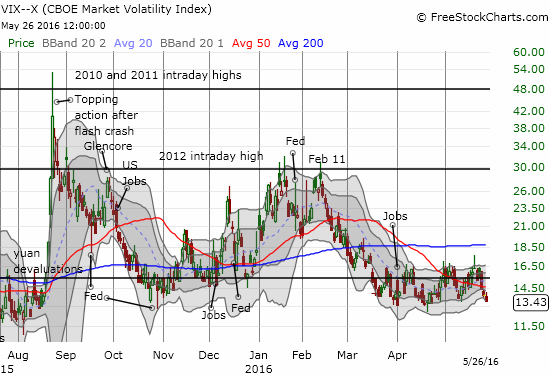
The volatility index has returned to the bottom of its recent range. Will this level continue to provide support?
While the two bearish trades I made last week are essentially dead in the water, I was able to lock in profits on a standing bullish play I mentioned earlier on JP Morgan Chase (NYSE:JPM). I took profits on Wednesday because JPM perfectly filled the gap down that began 2016.
If this turns out to be the end of the current bullish run, it would be a fitting end. Regardless, I will continue buying long-term call options on dips in JPM at “natural” support levels.
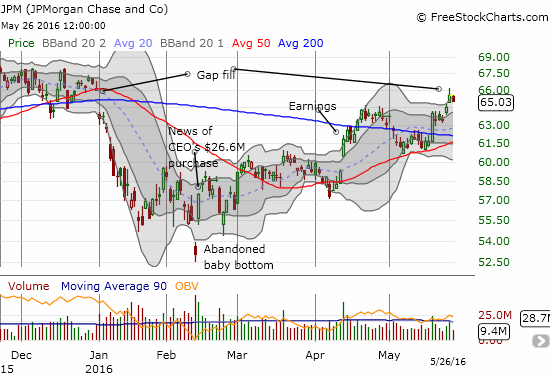
For a brief moment, JPM finally evened out for the year. Can it gather fresh buying momentum or is it time for another (buyable) rest?
Retail stocks have really captured my interest in the past week or more. As the bulls have re-established dominance in the market, I have noticed a LOT of gap buying on retail stocks that initially get clobbered. Sometimes the buying is quite dramatic. Sometimes gaps get filled on the same day. Sometimes the momentum continues past the first day – Advance Auto Parts Inc (NYSE:AAP) is a particularly emphatic example. I will let the charts speak for themselves! Buyers are definitely active in the aisle of May…
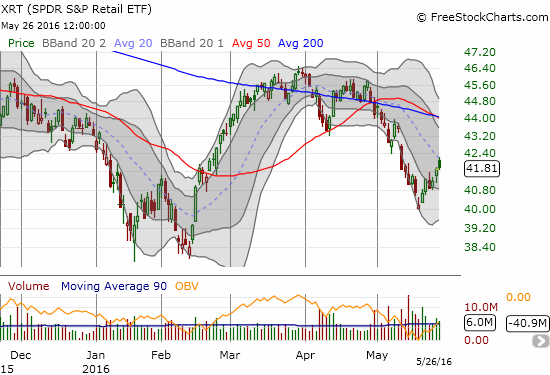
Sentiment has become bullish enough for bargain shoppers to start picking up shares in the beaten up retail sector: SPDR S&P Retail (NYSE:XRT) has steadily risen from the most recent ashes.
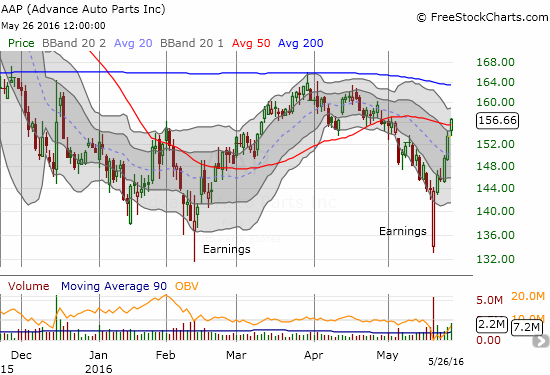
Advance Auto Parts (AAP) recovered from a 10%+ gap down in ONE day…buyers have been nearly relentless in loading up on shares that technically stopped being cheap after the gap filled.
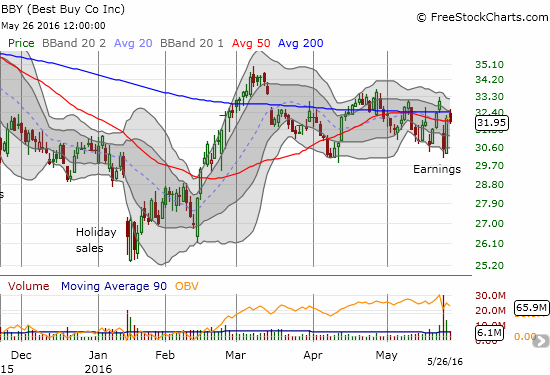
Best Buy Co Inc (NYSE:BBY) suffered in the trading following earnings. Buyers discovered the bargains the NEXT day and reversed almost all losses. Now buyers need to fight through a tangled mess of 50/200DMA resistance.
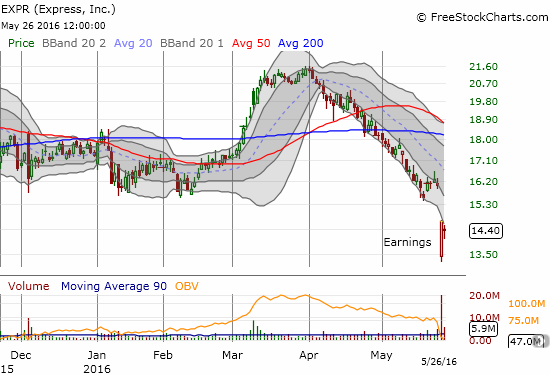
Express Inc (NYSE:EXPR) found buyers right at the post-earnings open. The bargain shopping was not enough to close the gap…yet.
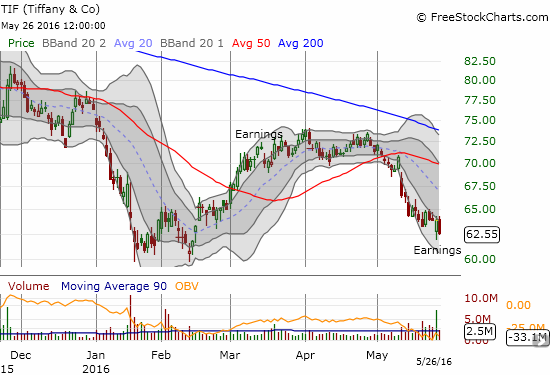
Tiffany & Co (NYSE:TIF) gapped down and found buyers right at the post-earnings open. However, sellers managed to regain control today with a new closing low. TIF may break the mold of quick retail recoveries and instead resume the previous downward momentum.
Just so you do not get the impression that buyers are scrambling to scoop up bargains in EVERY retailer reporting disappointing results, here is Abercrombie & Fitch Company (NYSE:ANF).
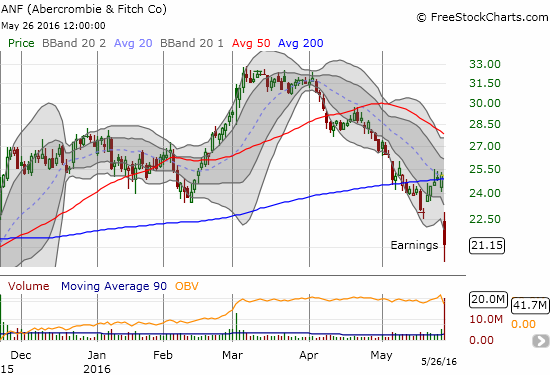
Sellers maintained control of Abercrombie & FItch (ANF) for most of the day’s post-earnings trading.
Finally, speaking of bargain hunting, even a stock like Netflix (NASDAQ:NFLX) looks cheap when sentiment turns bullish. The stock was languishing in a post-earnings funk below its 50DMA until last week. NFLX is up over 15% since last week’s closing lows.
On Thursday, we FINALLY got a whiff of what could be the fundamental driver of NFLX’s run-up: a rumor about Apple's interest in buying NFLX. Typically, the release of news marks the end of a rally as everyone who got the drop (or followed the traders in the know) are already positioned and ow ready to profit from their “insight.” However, this case is really buying on the rumor of a rumor. There is no real news yet.
Regardless, NFLX is incredibly stretched now. The stock faded off its highs right below 200DMA resistance. It has managed to close above its upper-Bollinger Band (BB) for just about four trading days straight. These conditions got me curious about the stochastics – something I have not checked in a very long time. Sure enough, even the stochastics are yelling “SELL!”. I could not resist buying put options here. If buyers readily overcome all these negative technicals, then I will KNOW the bulls and buyers are back to stay for a good long while.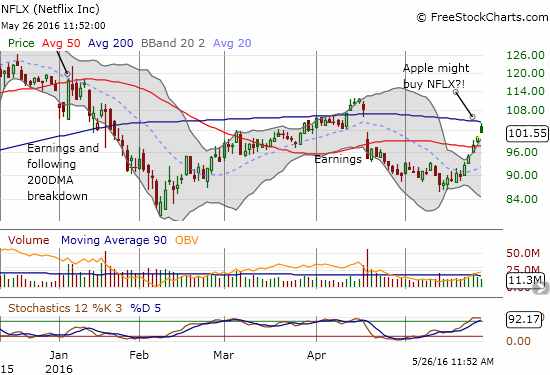
Netflix (NFLX) has been on fire. Now that the rumor is out, will traders continue to buy on an assumption that an Apple (NASDAQ:AAPL) for NFLX deal could actually happen?
Daily T2108 vs the S&P 500
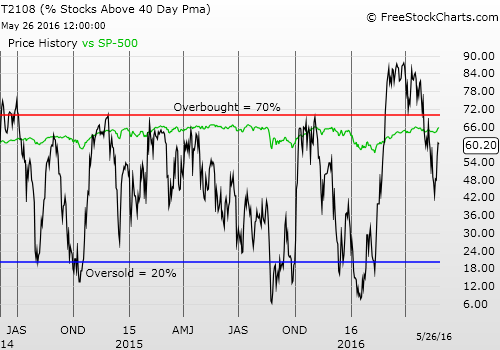
Black line: T2108 (measured on the right); Green line: S&P 500 (for comparative purposes)
Red line: T2108 Overbought (70%); Blue line: T2108 Oversold (20%)
Weekly T2108
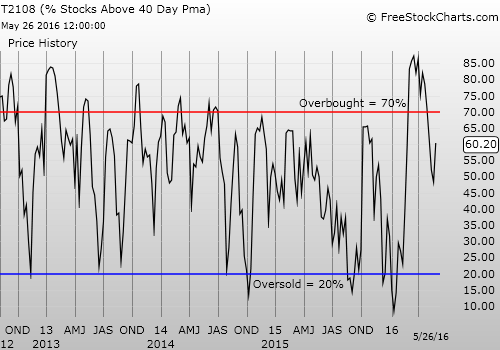
Be careful out there!
Full disclosure: long NFLX put options, short BBY
