Upcoming US Events for Today:
- FHFA House Price Index for July will be released at 9:00am. The market expects a month-over-month increase of 0.4%, consistent with the previous report.
- Flash Manufacturing PMI for September will be released at 9:45am. The market expects 58.1 versus 58.0 previous.
- Richmond Fed Manufacturing Index for September will be released at 10:00am. The market expects a reading of 12, consistent with the previous report.
Upcoming International Events for Today:
- German Flash Manufacturing PMI for September will be released at 3:30am EST. The market expects 51.2 versus 52.0 previous. PMI Services is expected to show 54.9 versus 56.4 previous.
- Euro-Zone Flash Manufacturing PMI for September will be released at 4:00am EST.The market expects 50.6 versus 50.8 previous. PMI Services is expected to show 53.0 versus 53.5 previous.
- Canadian Retail Sales for for July will be released at 8:30am EST. The market expects a month-over-month increase of 0.4% versus an increase of 1.1% previous.
- Japan Manufacturing PMI for September will be released at 9:35pm EST.

The Markets
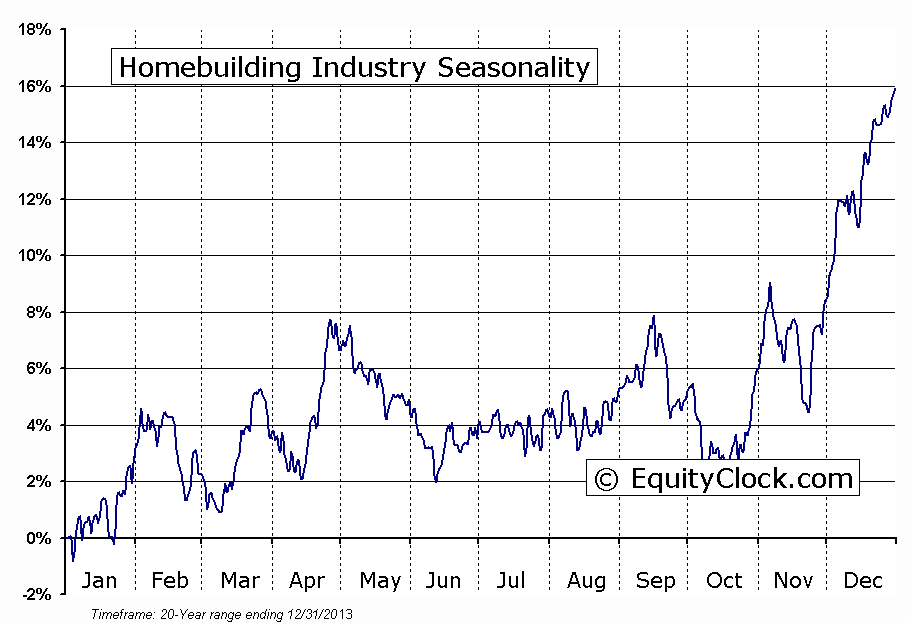
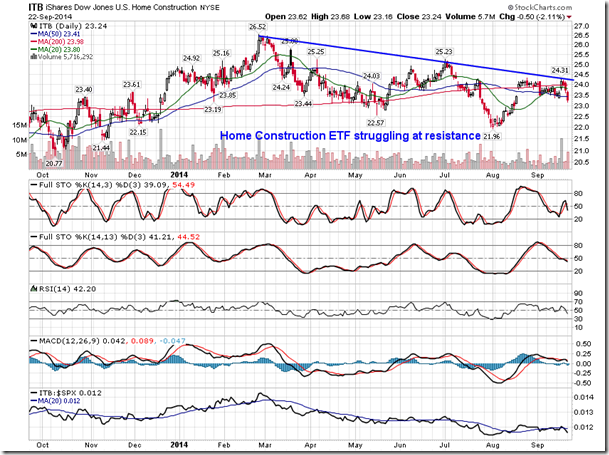
Stocks plunged on Monday following a weak housing report for the month of August. Existing Homes Sales unexpectedly declined last month by 1.8%, missing estimates calling for an increase of 1.0%. Housing reports continue on Tuesday and Wednesday with the FHFA House Price Index and New Home Sales, providing additional material to gauge this important part of the economy. As noted in previous reports, the housing market has shown signs of stalling since peaking last summer, just as treasury rates bounced from multi-decade lows. Building permits and new home sales have both plateaued and year-over-year house price gains are gradually deteriorating. This has resulted in significant underperformance in the home building stocks since February as the price of the US Home Construction ETF struggles at declining trendline resistance. Home builders remain in a period of seasonal weakness that stretches through to the end of October, leading to the period of seasonal strength for the industry then runs from the end of October through to February. The housing market is often looked upon as an important gauge of economic activity, therefore the sluggish results realized over recent months does give rise to concern, especially with lending rates only expected to rise within the next year.
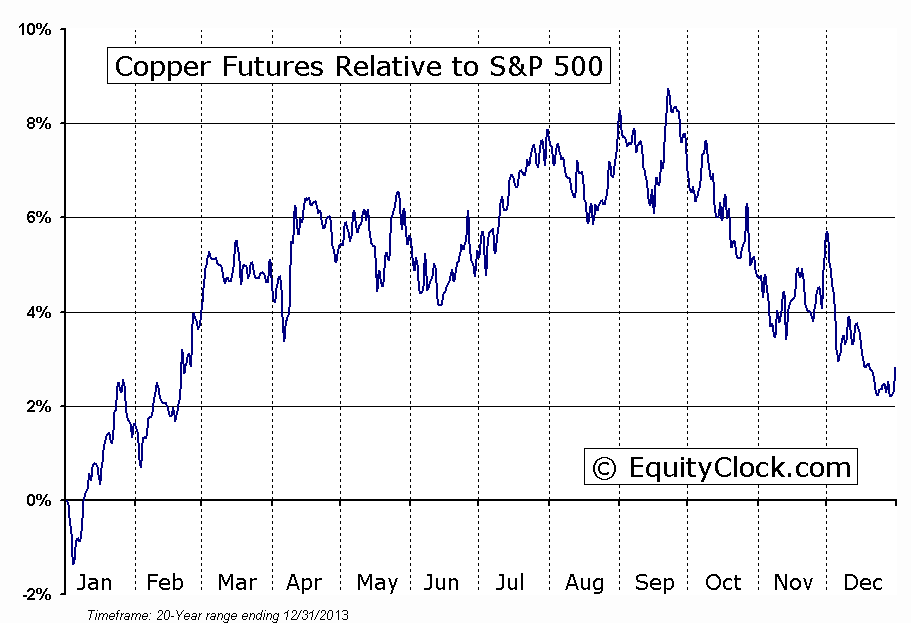
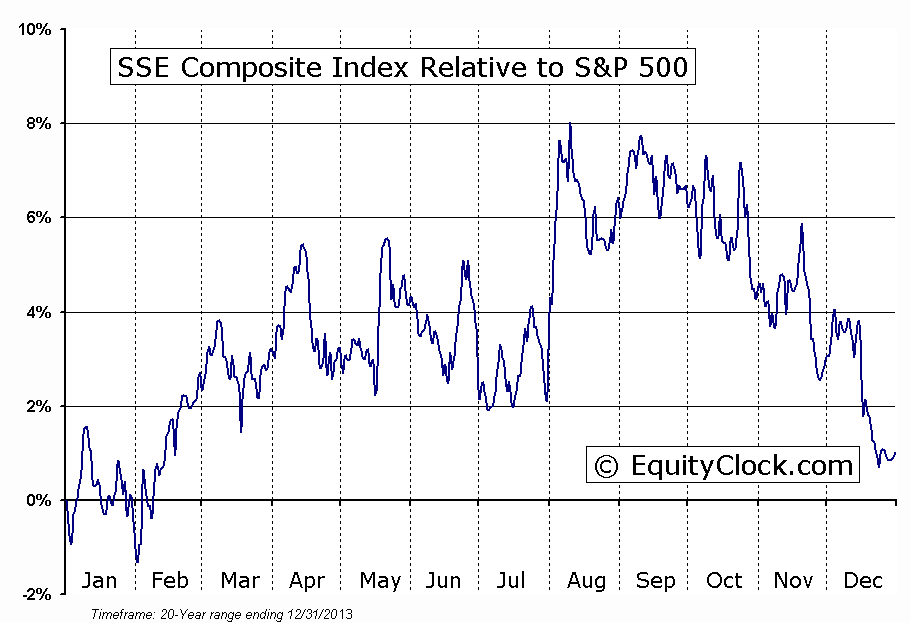
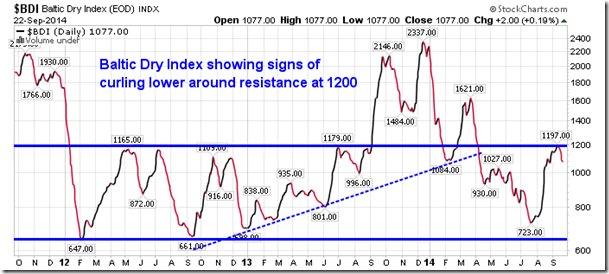
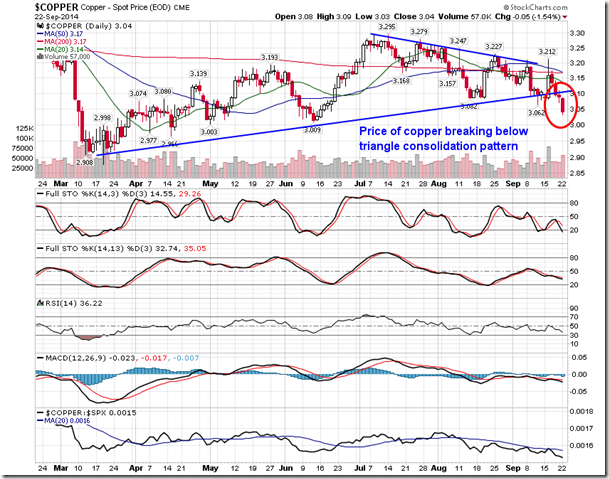
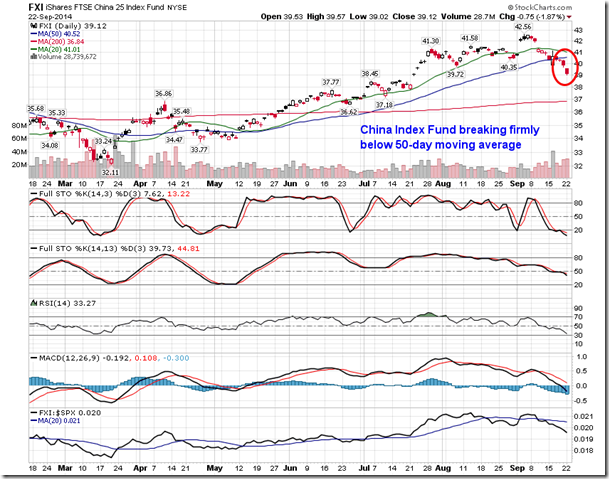
Another gauge of economic activity is also showing signs of struggle. The Baltic Dry Index, which provides “an assessment of the price of moving major raw materials by sea” is rolling over from resistance around 1200. The decline from resistance comes as the price of copper breaks below the lower limit of a triangle consolidation pattern, suggesting demand for raw materials may have hit a wall, particularly given the strength in the US Dollar. Copper recently entered a period of seasonal weakness that stretches through to December, providing the basis of further declines through the end of the year.This also has negative implications for the Chinese equity market given that China is one of the largest customers for the industrial metal. The FTSE China 25 Index broke firmly below its 50-day moving average during Monday’s session as concerns of a slowdown in China influenced investors to sell stocks. The equity market in China, as gauged by the Shanghai Composite, also enters a period of seasonal weakness at this time of year, similar to the price of Copper.
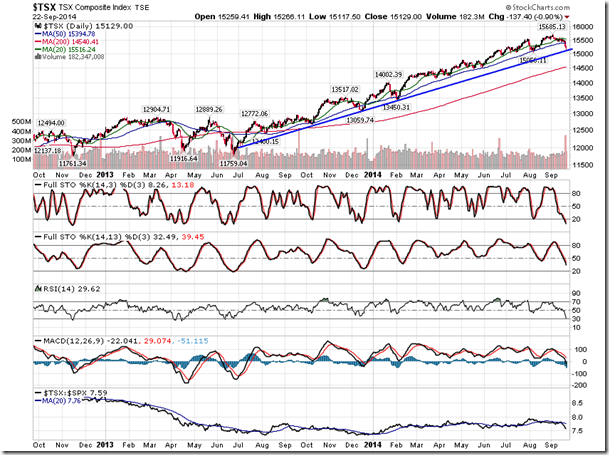
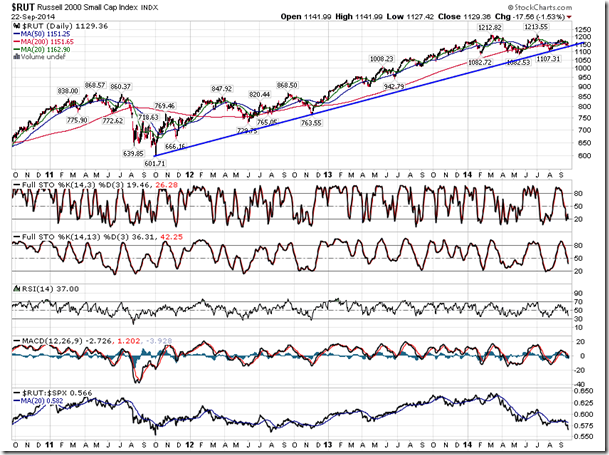
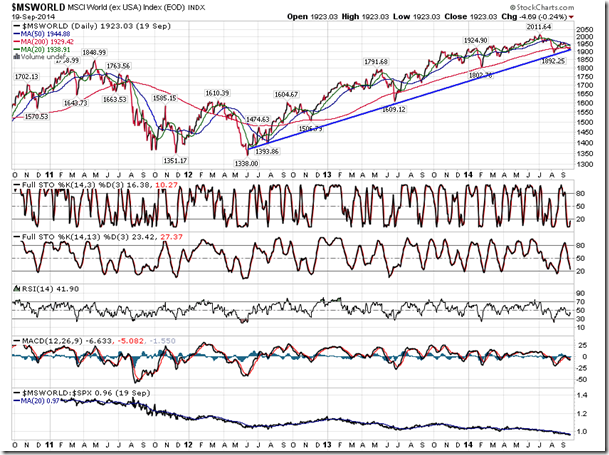
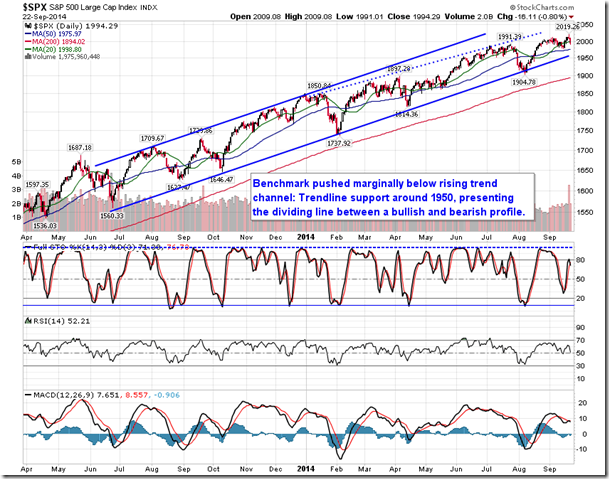
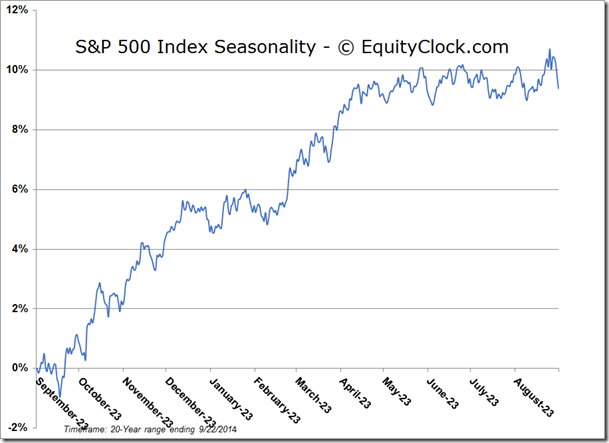
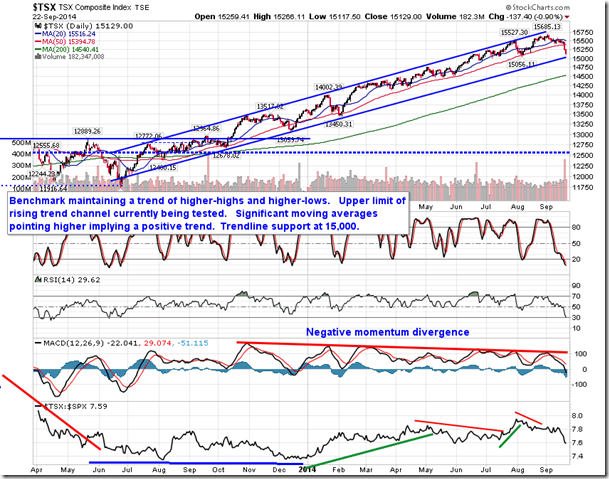
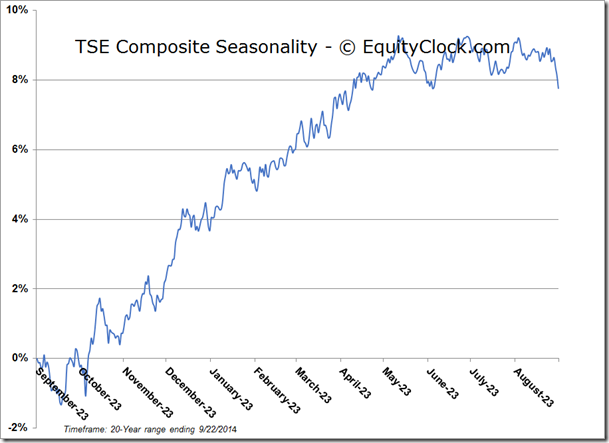
The declines in equities over recent days have pressured a number of benchmarks down to long-term trendline support. This includes the TSX Composite, which is testing support around 15,000, the Russell 2000 Index, which is testing support around 1130, and the MSCI World ex-US Index, which is testing support near 1920. A break of these key long-term trendlines would likely escalate selling pressures, fulfilling seasonal tendencies for this time of year that calls for broad market declines. Seasonal weakness between now and the end of October leads to appealing buying opportunities in cyclical sectors, particularly those relating to the consumer, for the period of seasonal strength for stocks ahead.
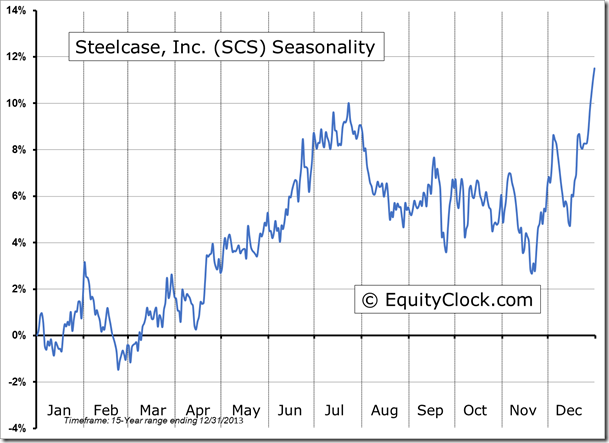
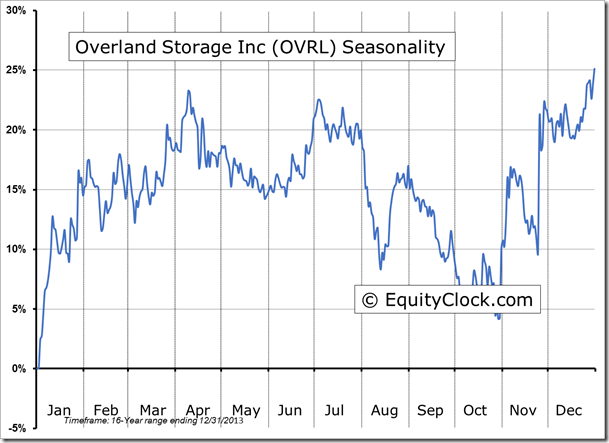
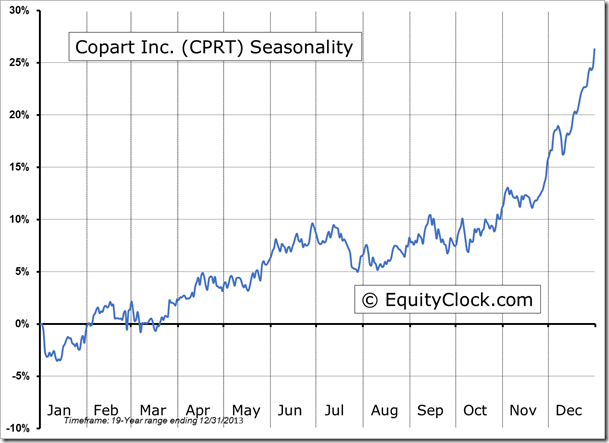
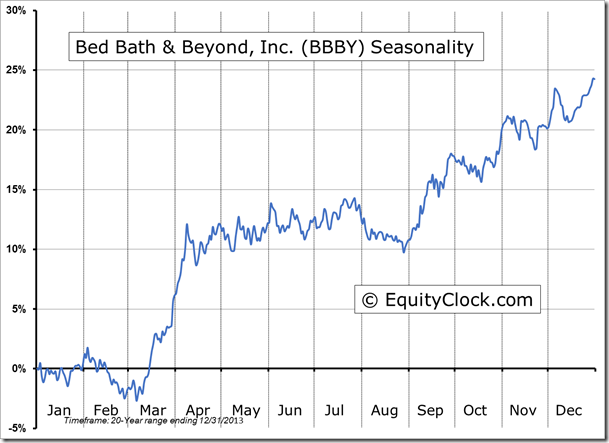
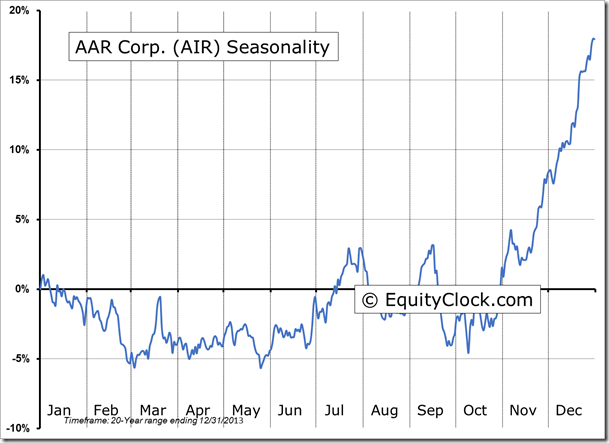
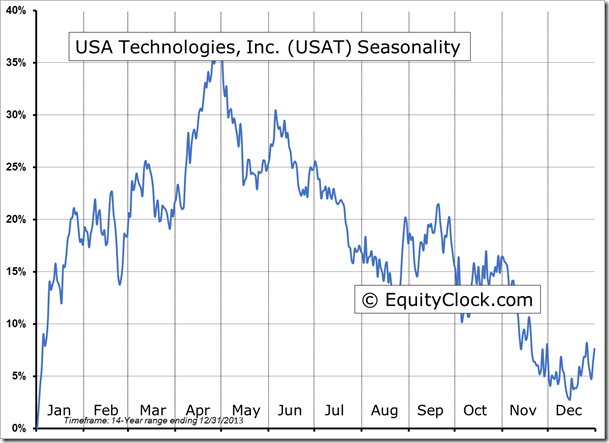
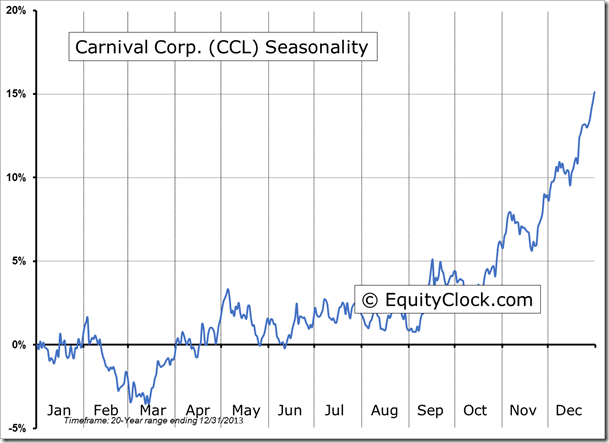
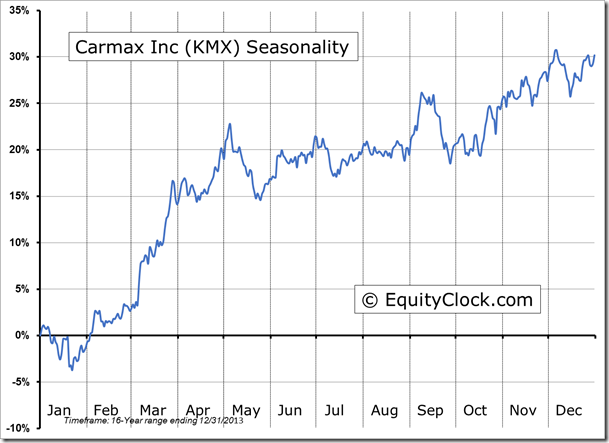
Seasonal charts of companies reporting earnings today:
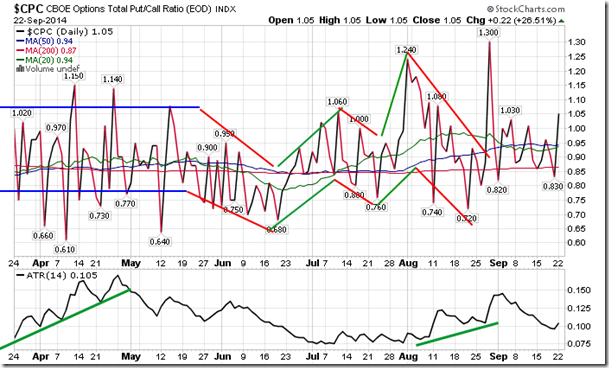
Sentiment on Monday, as gauged by the put-call ratio, ended bearish at 1.05.
S&P 500 Index
TSE Composite
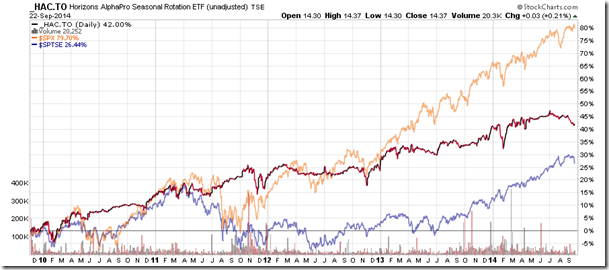
Horizons Seasonal Rotation ETF (TSX:HAC)
- Closing Market Value: $14.37 (up 0.21%)
- Closing NAV/Unit: $14.36 (up 0.02%)
Performance*
| 2014 Year-to-Date | Since Inception (Nov 19, 2009) | |
| HAC.TO | 0.42% | 43.6% |
* performance calculated on Closing NAV/Unit as provided by custodian
