Baker Hughes Incorporated (BHI) reports preliminary financial results for the quarter ended December 31, 2014.
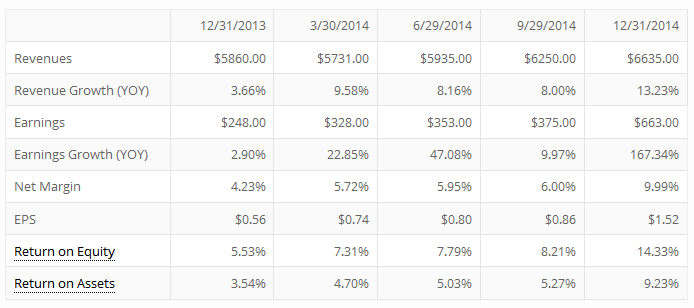
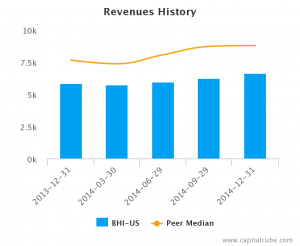
Baker Hughes Incorporated (BHI), which will be acquired by Halliburton later this year, reported record revenue of $6.6 B in Q4 2014 on Tuesday, January 20th, up 6 percent compared to Q4 of 2013.
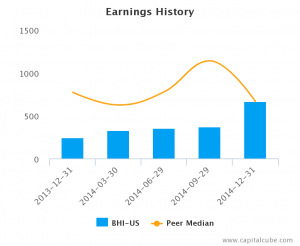
It also announced $663 million in net earnings , exceeding Wall Street expectations. The company is a global supplier of oilfield services, products, systems, and technology to the oil and natural gas industry, and a provider of industrial products to the chemical and energy industry. It operates in more than 80 countries, with the North American division leading revenue growth.
Baker Hughes and the other oil service providers assist the drilling firms in setting up oil wells, and the companies performance is hyper-sensitive to the price of oil. Despite its strong quarterly performance, Baker Hughes announced that they forecast the decline in oil prices will result in the loss of up to 60 percent of the number of oil rigs within the next 12 months. The company joined the ranks of the other oil service providers in announcing a layoff of workers. The jobs of 7,700—or 11 percent of its workforce—will be cut, in preparation for the anticipated order downturn from the plunge in oil prices, which have fallen almost 50 percent in the past 6 months
This earnings release follows the earnings announcements from the following peers of Baker Hughes Incorporated – Halliburton Company (NYSE:HAL) and Schlumberger NV (NYSE:SLB).
Highlights
- Summary numbers: Revenues of $6.64 B; Net Earnings of $663 million; and Earnings per Share (EPS) of $1.52.
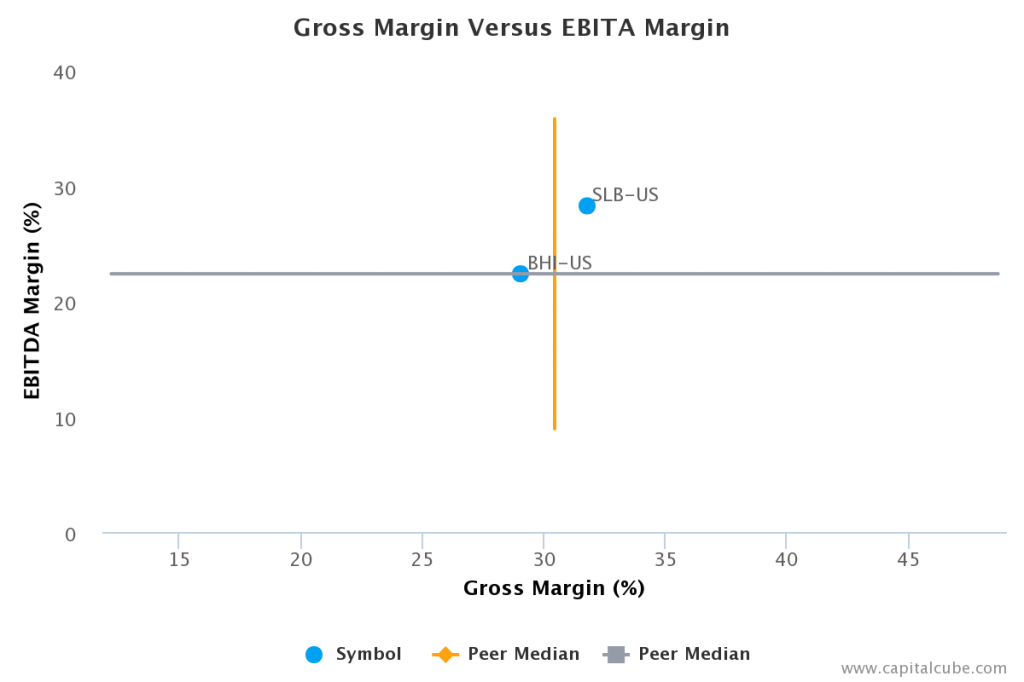
- Gross margins widened from 20.9 percent to 29.1 percent compared to the same quarter last year; operating (EBITDA margins) now 22.4 percent from 15.2 percent.
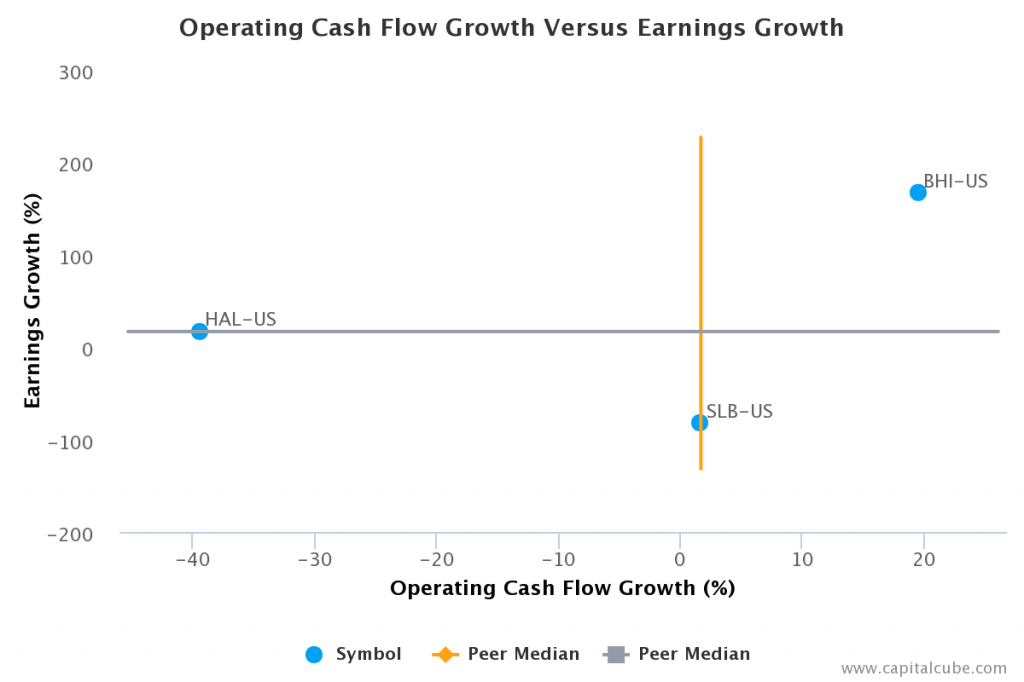
- Change in operating cash flow of 19.6 percent year-over-year trailed change in earnings,
- Earnings potentially benefiting from some unlocking of accruals.
- Earnings growth from operating margin improvements as well as one-time items.
The table below shows the preliminary results and recent trends for key metrics such as revenues and net income growth:
Market Share Versus Profits
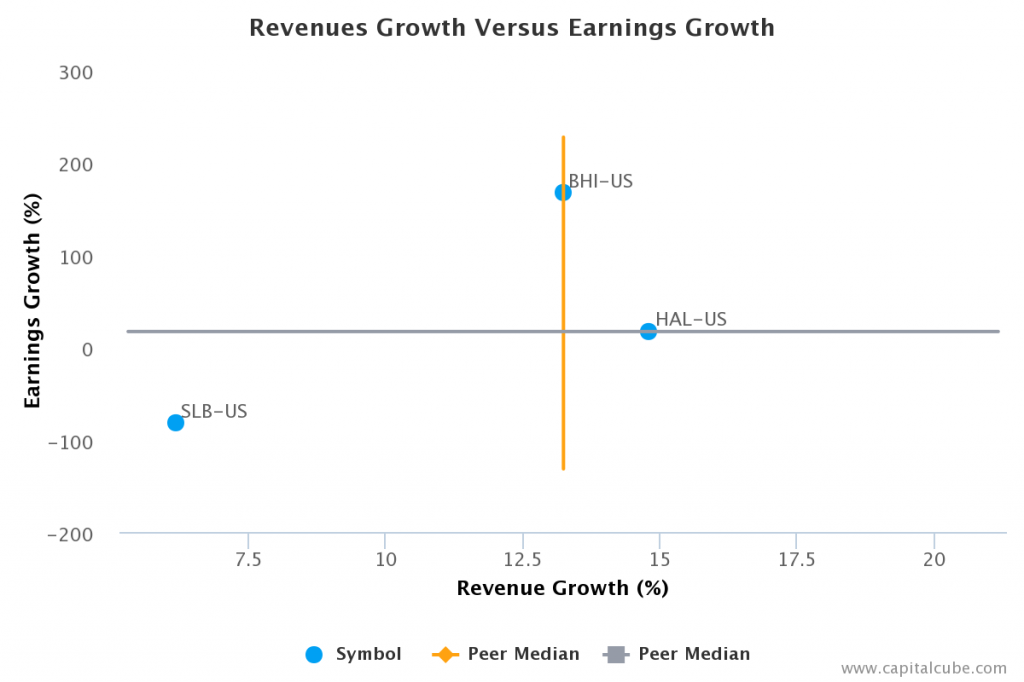
There is sometimes a tension in companies' performance between a focus on market share and a focus on profit or earnings growth.
Earnings Trend
Compared to the same quarter last year, Baker Hughes' change in revenue trailed its earnings performance, which, at $663 million, was more than double the earnings from the same quarter last year. The company's performance this period suggests a focus on boosting bottom-line earnings. While the revenue performance could be better, it is important to note that the quarterly change in revenue was second only to Halliburton among its peers thus far. Also, for comparison purposes, revenue changed by 6.2 percent and earnings by 76.8 percent compared to the immediate last quarter.
Earnings Growth Analysis
The company's earnings growth was influenced by year-on-year improvement in gross margins from 20.9 percent to 29.1 percent, as well as better cost controls. As a result, operating margins (EBITDA margins) rose from 15.2 percent to 22.4 percent compared to Q4 of 2013. For comparison, gross margins were 26.1 percent and EBITDA margins were 19.0 percent in Q3 of 2014.
Gross Margin Trend
Companies sometimes sacrifice improvements in revenues and margins in order to extend friendlier terms to customers and vendors. CapitalCube asseses such activity by comparing the changes in gross margins with any changes in working capital. If the gross margins improved without a worsening of working capital, it is possible that the company's performance is a result of truly delivering in the marketplace and not simply an accounting prop-up using the balance sheet.
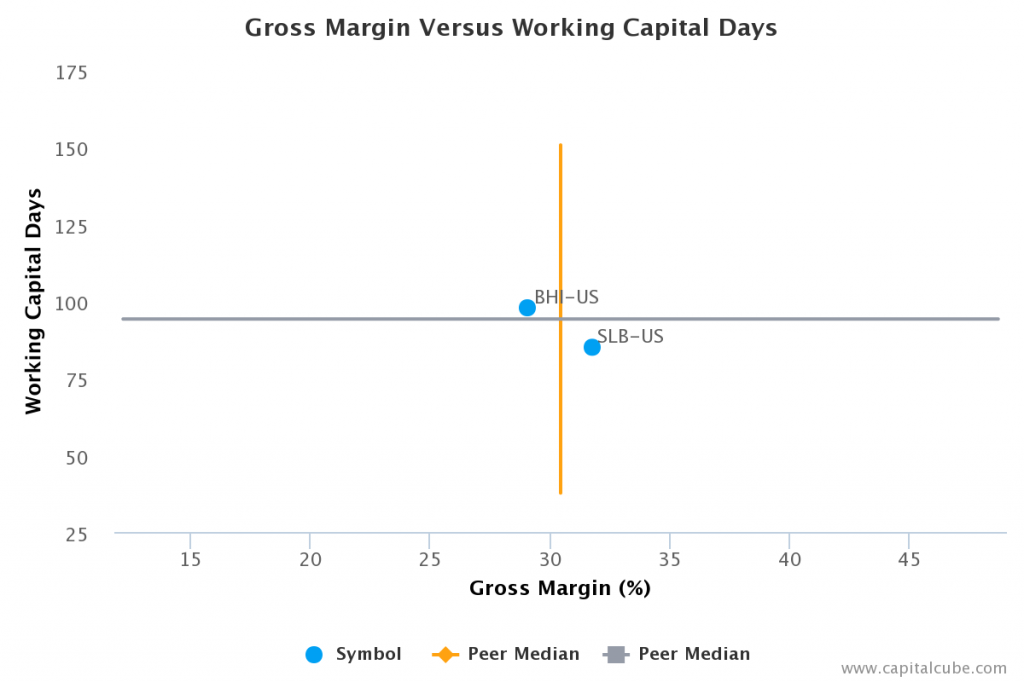
Baker Hughes' improvement in gross margin has been accompanied by an improvement in its balance sheet as well. This suggests that gross margin improvements are likely from operating decisions and not accounting gimmicks. Its working capital days have declined to 97.8 days from 105.0 days for the same period last year.
Cash Versus Earnings – Sustainable Performance?
Baker Hughes' year-on-year change in operating cash flow of 19.6 percent trailed its change in earnings. This leads CapitalCube to question whether the earnings number might have been achieved from some unlocking of accruals. In addition, the increase in operating cash flow was less than the average announced thus far by its peer group.
Margins
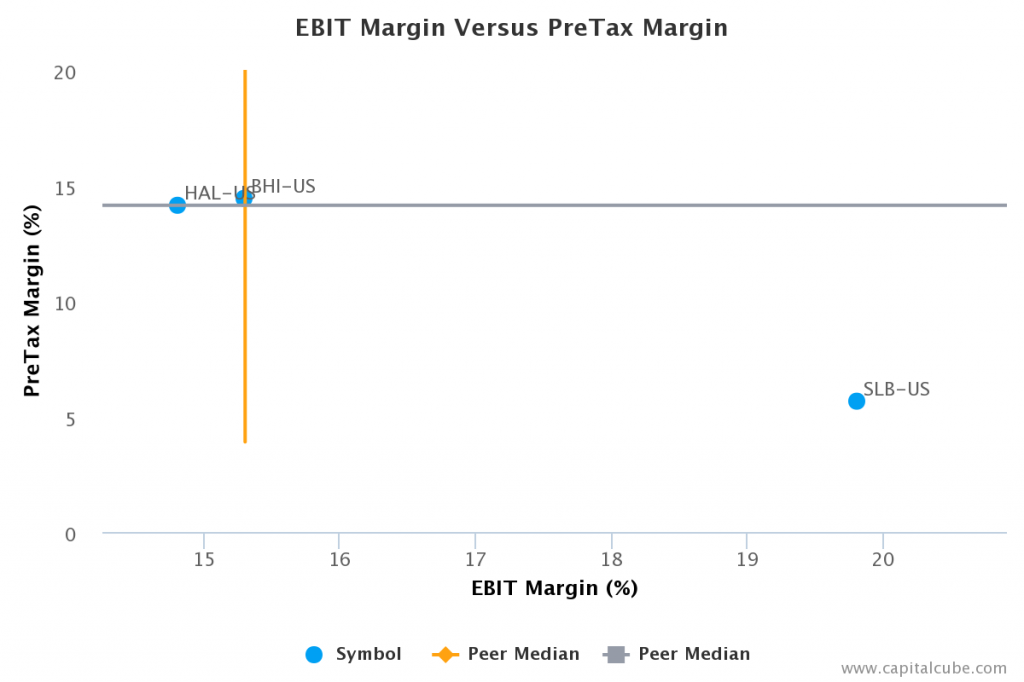
The company's earnings growth has also been influenced by the following factors: (1) Improvements in operating (EBIT) margins from 7.7 percent to 15.3 percent and (2) One-time items. The company's pretax margins are now 14.4 percent compared to 7.2 percent for the same quarter last year.
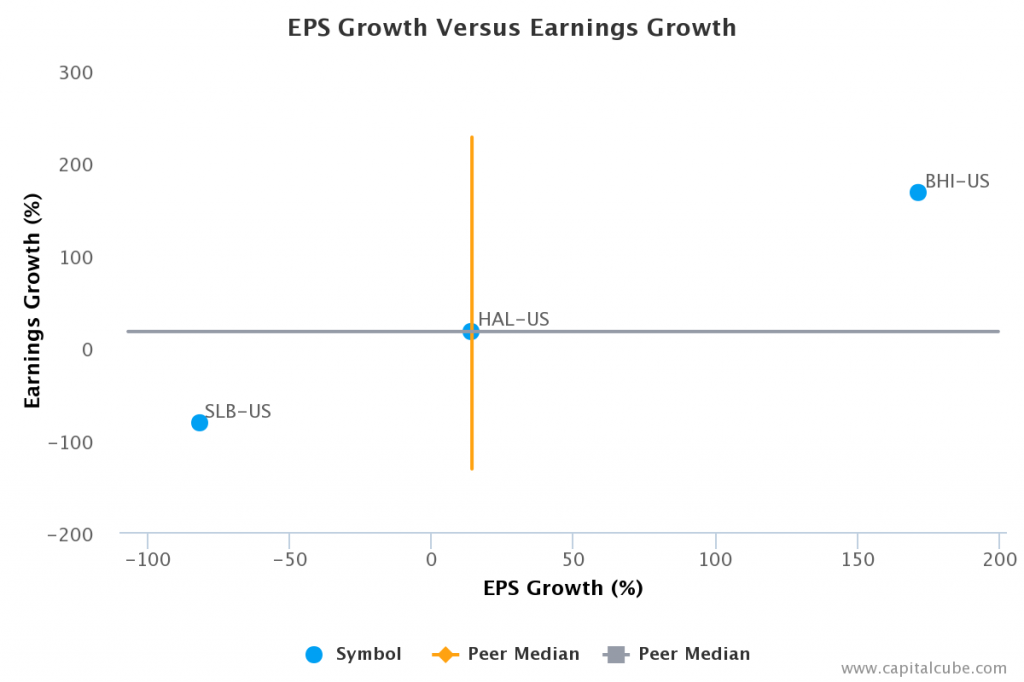
EPS Growth Versus Earnings Growth
Baker Hughes change in Earnings per Share (EPS) of 171.4 percent year-over-year is better than its change in earnings of 167.3 percent. However, the change in earnings is better than the peer average among the results announced to date, suggesting that the company is gaining ground in generating profits from its competitors.
Company Profile
Baker Hughes, Inc. is a supplier of oilfield services, products, technology and systems to the worldwide oil and natural gas industry. It also provides industrial and other products and services to the downstream refining, and process and pipeline industries. The company's oilfield products and services are categorized under two heads: Drilling and Evaluation or Completion and Production. The Drilling and Evaluation consists of various product lines, including drill bits, drilling services, wireline services and drilling fluids. The Completion and Production consists of various product lines, including completion systems, wellbore intervention, intelligent production systems, artificial lift, upstream chemicals and pressure pumping. Baker Hughes operates through five reportable segments: North America, Latin America, Europe, Africa and Russia Caspian, Middle East and Asia Pacific and Industrial Services and Other. Its other businesses also include downstream refining, and process and pipeline services. The company was founded in April 1987 and is headquartered in Houston, TX.
