With a drop in the Shiller CAPE 10 values due to the sell off in US stock prices, your asset allocation approach may soon find more attractive relative value in US stocks over US bonds suggesting a shift to a heavier stock allocation may be prudent. However as every experienced money manager knows, just because a change in price may improve a security’s or asset class’ attractiveness doesn’t mean you should change your portfolio allocation … you must take your analysis a step further to do what you can to avoid a potential value trap. The following paragraphs will explain, in the context of a US dynamic asset allocation model set, what I am referring to and what to do about it.
Example
Assume by April 1 this year, the Shiller CAPE 10 has fallen to the 80th percent rank pushing-up our return expectations on US Stocks from 2% to 5%.
Also assume by April 1, interest rates on 10-year maturities are approximately where they are today and our return expectation on US Bonds remains at 2%.
If we assume our risk expectation for US Stocks is 15% and 6.5% for US Bonds, then our return/risk expectations:
- US Stocks: 5/15 = 33% efficiency
- US Bonds: 2/6.5 = 30% efficiency
So a dynamic shift out of US bonds appears to make sense… not necessarily.
Let’s take a look at what I am talking about…
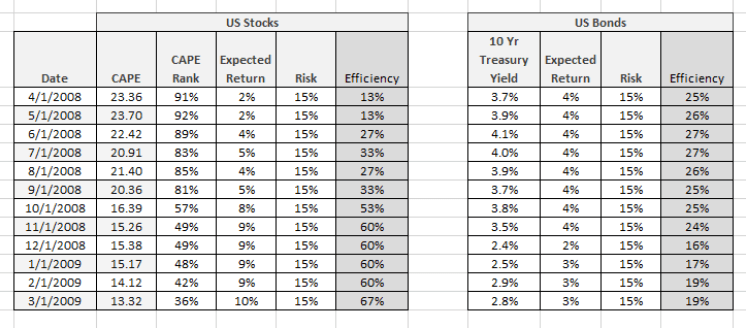
Here are monthly changes in the dynamic asset class expectations during the last crash in US stocks.

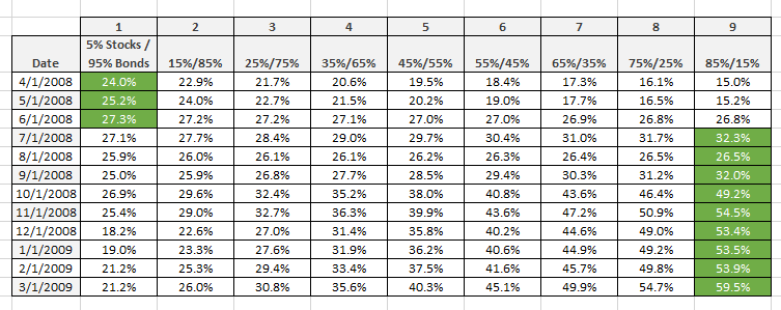
Utilizing efficiency across our model set, we can see below a shift from 5% to 85% to US Stocks in July 2008.

Yet US stock prices did not bottom until March 2009.
Utilizing Trends
Combining the relative efficiency of asset classes PLUS price trends appears to be a potential solution.
US Stocks
- Factor – S&P 500 Price Trend Calculation
- Subtract the current index price from the 10-month moving average.
- Factor – S&P 500 VIX Price Trend Calculation
- Subtract the current VIX trend in price from the previous trend in price.
There’s a hitch however, VIX prices can increase with underlying index prices such as during the run-up to the dot.com bubble. Therefore divide the index price by the VIX price, calculate the 10-month moving average, and subtract the current 10-month moving average from the previous moving average.
Avoiding the Asset Allocation Value Trap
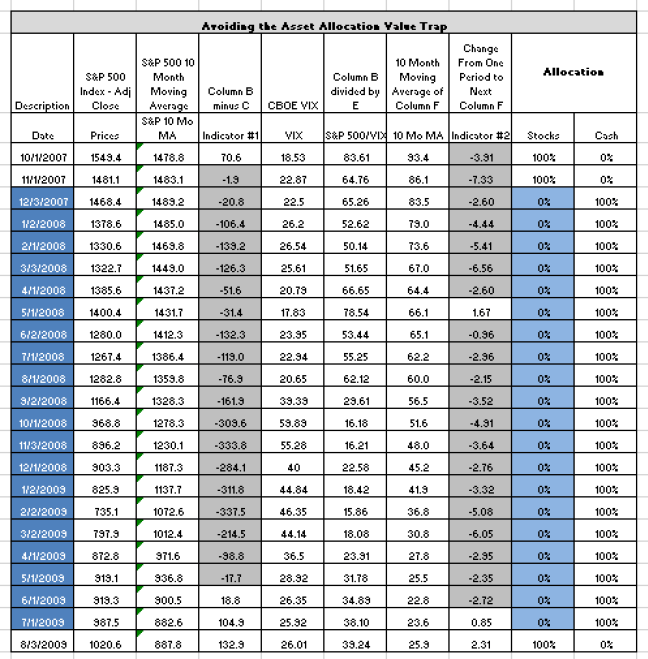
This combination in trends therefore enables us to wait to re-allocate during a critical period when valuations are telling us an asset class and model is more attractive but the trend in prices and volatility is telling us to be patient.
This table illustrates the re-entry point for a US stocks allocation during the corresponding time frame when US stock valuations made US stocks more attractive. In this approach, both factor indicators are working in unison preceding the shift.

Here is the xls to look at the numbers and calculations…
