Get 40% Off
🚨 Volatile Markets? Find Hidden Gems for Serious OutperformanceFind Stocks Now

The Normalized VIX Futures Term Structure Graph

Published 01/28/2015, 01:31 AM
Updated 07/09/2023, 06:31 AM

One graphic I post periodically that never fails to generate a great deal of interest among traders, strategists and other volatility aficionados is my normalized VIX futures term structure graph. From 2008 – 2013, the annual normalized term structure is notable in that almost every year there is an outlier in one way or another. For instance, 2012 and 2013 were the two years with the steepest contango in history, while 2008, 2009 and 2011 represent three of the four years (2007 being the fourth) with the flattest term structure.

And 2014? It could not have been more average. If one combines all the years from 2004 to 2014 and creates an “average year” (i.e., the wide gray line on the chart) then 2014 (double blue line) comes closest to that average.
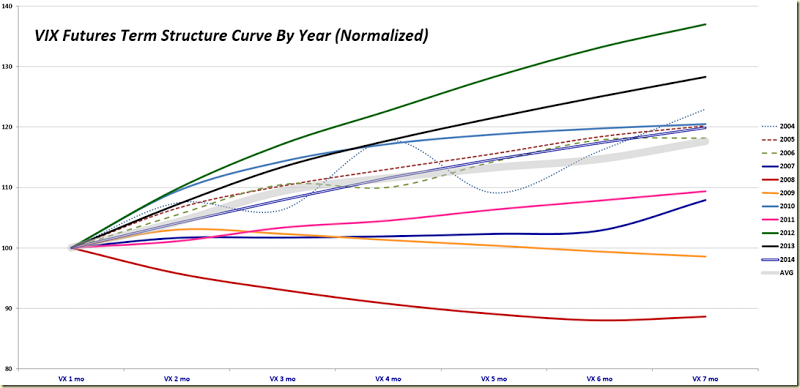
VIX Futures Term Structure Curve By Year (Normalized)

Note that the terms structure lines are dotted and somewhat wavy for 2004 – 2006, due to the fact that the CBOE did not implement a full complement of consecutive monthly futures until October 2006.

As for 2015, which is not plotted on the graph above, so far it looks quite flat, almost like a cross between 2007 and 2009. It will be interesting to see if this pattern holds for the balance of the year.

Original post

Latest comments

Risk Disclosure: Trading in financial instruments and/or cryptocurrencies involves high risks including the risk of losing some, or all, of your investment amount, and may not be suitable for all investors. Prices of cryptocurrencies are extremely volatile and may be affected by external factors such as financial, regulatory or political events. Trading on margin increases the financial risks.
Before deciding to trade in financial instrument or cryptocurrencies you should be fully informed of the risks and costs associated with trading the financial markets, carefully consider your investment objectives, level of experience, and risk appetite, and seek professional advice where needed.
Fusion Media would like to remind you that the data contained in this website is not necessarily real-time nor accurate. The data and prices on the website are not necessarily provided by any market or exchange, but may be provided by market makers, and so prices may not be accurate and may differ from the actual price at any given market, meaning prices are indicative and not appropriate for trading purposes. Fusion Media and any provider of the data contained in this website will not accept liability for any loss or damage as a result of your trading, or your reliance on the information contained within this website.
It is prohibited to use, store, reproduce, display, modify, transmit or distribute the data contained in this website without the explicit prior written permission of Fusion Media and/or the data provider. All intellectual property rights are reserved by the providers and/or the exchange providing the data contained in this website.
Fusion Media may be compensated by the advertisers that appear on the website, based on your interaction with the advertisements or advertisers.
© 2007-2024 - Fusion Media Limited. All Rights Reserved.