Forex News and Events
Spillover effect of Petroleo (N:PBR) scandal hit BRL
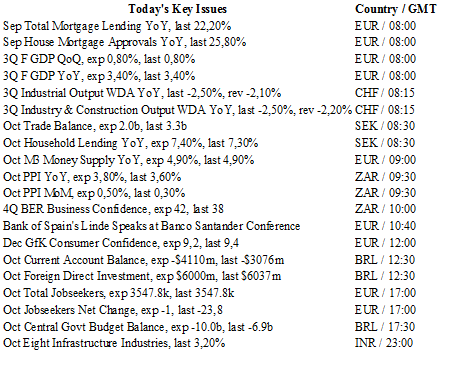
The Petrobras corruption scandal continues to make headlines as the investigation continues. More heads will roll. Dilma Rousseff took another hit yesterday as the police arrested Delcidio do Amaral - one of Rousseff's last strong supporters and head of the Senate Economics Committee - for allegedly trying to interfere with ongoing investigations. This is another setback for Rousseff but also for the Brazilian economy as a whole, slowing down the recovery process by postponing the approval of austerity measures. The bottom line is that the Brazilian economy continues to slide further into recession as the political gridlock persists and corruption probe advances. USD/BRL jumped 1.25% yesterday amid headlines. The Brazilian real is expected to remain under pressure as investors digest the information.
Australia: Business investment vs. paper market
When commodities price lower, there is a transfer of wealth between exporters (producers) and importers of commodities. The decline favours industries that need commodities as primary source for manufacturing products. Australia is on the exporters’ side. Indeed, an important part of the Australian’s revenues accounts for the revenues on the extraction of gold, silver, platinum and other metals.
The consequences of low commodities prices are weighing on the Australian economy and are now reflected in the current business investment data which declined 9.2% q/q for the third quarter. We believe this is partially because Australia is being hit by a major contraction of the commodities markets. The negative demand of the paper market (gold for example) also drives down the price of the physical market as there is no decorrelation between those two and especially because of the sheer size of the paper market. More specifically, there are two hundred times more paper ounces of gold than physical ounces. At the same time the demand for physical commodities has exploded. And at some point, we cannot say that the paper market is a hedge for the physical one as the difference in size is so great. We believe that Australia’s issues with this contraction is not likely to lessen as the paper market continues to expand at a massive pace.
USD/CHF - Bullish Momentum Keeps Going.


The Risk Today
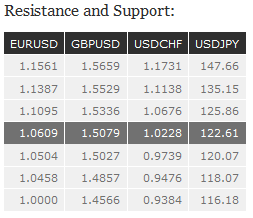
EUR/USD is consolidating around 1.0600 and remains in a downtrend channel. The technical structure is clearly negative. Hourly support at 1.0591 (23/11/2015 low) has been broken. New hourly support lies at 1.0566 (intraday low). Hourly resistance can be found at 1.0763 (19/11/2015 high). Stronger resistance stands at 1.0897 (05/11/2015 high). Expected to show continued weakness. In the longer term, the technical structure favours a bearish bias as long as resistance holds. Key resistance is located region at 1.1453 (range high) and 1.1640 (11/11/2005 low) is likely to cap any price appreciation. The current technical deteriorations favours a gradual decline towards the support at 1.0504 (21/03/2003 low).
GBP/USD remains in a medium term downtrend channel. Hourly support is given at 1.5027 (06/11/2015 low). Hourly resistance is given at 1.5336 (19/11/2015 high). Strong resistance can be found at 1.5529 (22/09/2015 high). Expected to show continued weakness. The long-term technical pattern is negative and favours a further decline towards the key support at 1.5089 , as long as prices remain below the resistance at 1.5340/64 (04/11/2015 low see also the 200 day moving average). However, the general oversold conditions and the recent pick-up in buying interest pave the way for a rebound.
USD/JPY has reversed recent bullish momentum, correcting sharply lower. Resistance is given at 123.76 (18/11/2015 high). Support is located at 122.23 (16/11/2015 low). Expected bounce from the support at 122.23. A long-term bullish bias is favored as long as the strong support at 115.57 (16/12/2014 low) holds. A gradual rise towards the major resistance at 135.15 (01/02/2002 high) is favored. A key support can be found at 116.18 (24/08/2015 low).
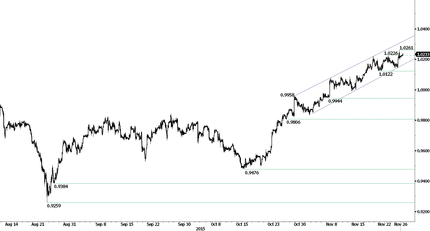
USD/CHF has set a new five-year high by breaking hourly resistance at 1.0226 (23/11/2015 high). Hourly support is given at 1.0122 (18/11/2015 low) while hourly resistance is given at 1.0261 (intraday high). The technical structure still suggests that the upside momentum should continue. In the long-term, the pair has broken resistance at 0.9448 and key resistance at 0.9957 suggesting further uptrend. Key support can be found 0.8986 (30/01/2015 low). As long as these levels hold, a long term bullish bias is favoured.

