Australia 200 for Thursday, November 6, 2014
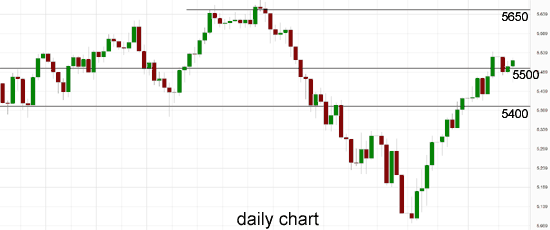
The Australia 200 index has enjoyed a solid resurgence over the last month after getting much needed support from the 5200 level, which has resulted in it moving back above the 5400 and 5500 levels, around a two month high. The latter level is now starting to provide the index some support as it looks to consolidate. Throughout most of September the Australia 200 Index declined strongly from its multi-year high after running into resistance around 5650 back to enter its previously established trading range between 5400 and 5500, before falling further below 5200 and to an eight month low around 5120 a few weeks ago. Several weeks ago it received solid support from the 5100 level which saw it rally well to close out a couple of weeks ago. Back in early September the 5400 level was called upon to offer support as the index desperately tried to stay in touch with its range, however it fell through there before rallying strongly back up to 5400. Up until recently, the 5400 level had done well and propped up price to keep it within the range.
In its recent fall at the beginning of August it moved down to a three week low around 5375, however it received solid support at the 5400 level which has allowed to consolidate and rally higher. The solid move higher throughout July saw it move strongly up through both the 5500 and 5550 levels to reach a then six year high around 5620. In recent weeks it has discovered a new key level to deal with after running into a short term resistance level at 5550, which earlier last week provided some solid support. It reversed strongly several weeks ago bringing it back down to almost touch the 5400 level before rallying back higher again. At the beginning of June the Australian 200 Index fell and broke back down through the key 5500 level towards a four week low around 5400 before consolidating and resting on support there for an extended period.
Back at the end of May, it moved back and forth between the two key levels of 5500 and 5550 before the recent fall. Over the last couple of months the Australia 200 Index has formed an amazing attraction to the key 5500 level as it spent a considerable amount of time trading around it. A couple of weeks ago, the index fell away heavily back down to support around 5400 before returning to the key 5500 level just as quickly, as if gravity had pulled it back. The index has done very well over the last couple of years moving from below 4000 to its present trading levels around 5500.
Activity in the Australian services sector has fallen for an eighth consecutive month, weighed down by slow wages growth and weak consumer confidence. The Australian Industry Group’s Australian Performance of Services Index (PSI) was down 1.8 points to 43.6 in October, its lowest since August 2013. A reading below 50 indicates the sector is contracting. The lower the number the faster the contraction. Ai Group chief executive Innes Willox says that if business and household confidence doesn’t improve then the services sector and the broader economy won’t strengthen. “The extended weakness in the services sector indicated by the Australian PSI is a major disappointment and reinforces concerns about the sluggish conditions across much of the local economy,” he said. “Both the ongoing wind-down in mining construction activity and flat conditions in the manufacturing industry are detracting from demand for business services while slow growth in household disposable income and a flat labour market are subduing consumer sentiment.”

Australia 200 November 5 at 22:20 GMT 5519 H: 5525 L: 5462
Australia 200 Technical
| S3 | S2 | S1 | R1 | R2 | R3 |
| 5500 | 5100 | — | 5650 | — | — |
During the hours of the Asian trading session on Thursday, the Australia 200 Index will be trying to maintain its recent good form and remain above the key 5500 level, after recently breaking through the 5200 level for the first time since February 2014, before surging higher in the last month. For most of this year the Australia 200 Index has moved well from the lower support level at 5000 up to the multi-year highs above 5500 in the last month or so.
Further levels in both directions:
• Below: 5500 and 5100.
• Above: 5650.
Economic Releases
- 00:30 AU Unemployment (Oct)
- 05:00 JP Leading indicator (Prelim.) (Sep)
- 09:30 UK Industrial Production (Sep)
- 09:30 UK Manufacturing Production (Sep)
- 12:00 UK BoE MPC – APF Total (Nov)
- 12:00 UK BoE MPC – Base Rate
- 12:45 EU ECB – Interest Rates
- 13:00 EU Euro-Area Finance Ministers Meet in Brussels
- 13:30 CA Building permits (Sep)
- 13:30 US Initial Claims (01/11/2014)
- 13:30 US Non Farm Productivity (Prelim.) (Q3)
- 13:30 US Unit Labour Costs (Prelim.) (Q3)
- 15:00 CA Ivey PMI (Oct)
- 15:00 UK NIESR GDP Est. (Oct)
- JP BoJ release minutes
