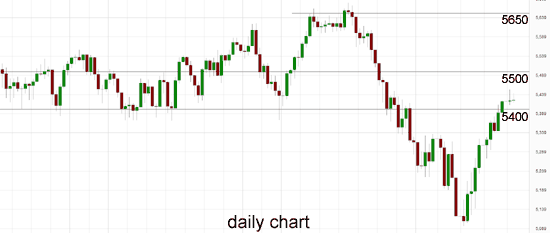
Australia 200 for Tuesday, October 28, 2014
Throughout most of September the Australia 200 Index declined strongly from its multi-year high after running into resistance around 5650 back to enter its previously established trading range between 5400 and 5500, before falling further below 5200 and to an eight month low around 5120 a couple of weeks ago. It has however enjoyed a solid resurgence over the last couple of weeks after getting much needed support from the 5200 level and has now returned to its previous range above 5400 which is a pivotal sign and is likely to encourage some more bullish sentiment. A couple of weeks ago it received solid support from the 5100 level which saw it rally well to close out a couple of weeks ago. Several weeks ago the 5400 level was called upon to offer support as the index desperately tried to stay in touch with its range, however it fell through there before rallying strongly back up to 5400. Up until recently, the 5400 level had done well and propped up price to keep it within the range.
In its recent fall at the beginning of August it moved down to a three week low around 5375, however it received solid support at the 5400 level which has allowed to consolidate and rally higher. The solid move higher throughout July saw it move strongly up through both the 5500 and 5550 levels to reach a then six year high around 5620. In recent weeks it has discovered a new key level to deal with after running into a short term resistance level at 5550, which earlier last week provided some solid support. It reversed strongly several weeks ago bringing it back down to almost touch the 5400 level before rallying back higher again. At the beginning of June the Australian 200 Index fell and broke back down through the key 5500 level towards a four week low around 5400 before consolidating and resting on support there for an extended period.
The 5400 and 5500 levels firmly established themselves as significant and now that we have seen a substantial break to one side, momentum has kicked in and seen the index fall strongly lower. Back at the end of May, it moved back and forth between the two key levels of 5500 and 5550 before the recent fall. Over the last couple of months the Australia 200 Index has formed an amazing attraction to the key 5500 level as it spent a considerable amount of time trading around it. A couple of weeks ago, the index fell away heavily back down to support around 5400 before returning to the key 5500 level just as quickly, as if gravity had pulled it back. The index has done very well over the last couple of years moving from below 4000 to its present trading levels around 5500.
Not even super-low interest rates are tempting consumers and businesses out of spending hibernation in Australia. Business confidence was flat in the September quarter, according to figures from the National Australia Bank last Thursday. Forward orders eased, suggesting sluggish domestic demand, and while business conditions did rise, most of the gains came from a surprise jump in July which had since eased off, the report said. NAB chief economist Alan Oster said expectations of any significant rebound in domestic demand were premature. “Both consumers and business remain cautious about spending, despite encouragement from very low interest rates, which is unsurprising given slower rates of income growth,” he said. “Consequently, corporate leverage ratios are low and household savings rates remain high, although there have been signs of improvement more recently.” On the plus side, strong residential construction, boosted by low interest rates and strong investor demand, including foreign investors, would have flow-on effects to the rest of the economy, Mr Oster said. Recent falls in the Australian dollar would also help export competitiveness, but could have a negative impact for some businesses, he said.

Australia 200 October 28 at 01:40 GMT 5422 H: 5441 L: 5417
Australia 200 Technical
| S3 | S2 | S1 | R1 | R2 | R3 |
| 5100 | — | — | 5500 | 5650 | — |
During the hours of the Asian trading session on Tuesday, the Australia 200 Index is trying to maintain its recent good form and remain above the key 5400 level, after recently breaking through the 5200 level for the first time since February 2014. For most of this year the Australia 200 Index has moved well from the lower support level at 5000 up to the multi-year highs above 5500 in the last month or so.
Further levels in both directions:
• Below: 5100.
• Above: 5500 and 5650.
Economic Releases
- 22:50 (Mon) JP Industrial Production (Prelim.) (Sep)
- 12:30 US Durable goods orders (Sep)
- 12:30 US Durables ex transport (Sep)
- 13:00 US S&P Case-Shiller Home Price (Aug)
- 14:00 US Consumer Confidence (Oct)
- US Federal Reserve FOMC meeting (to 29th)
