Australia 200 for Thursday, November 20, 2014
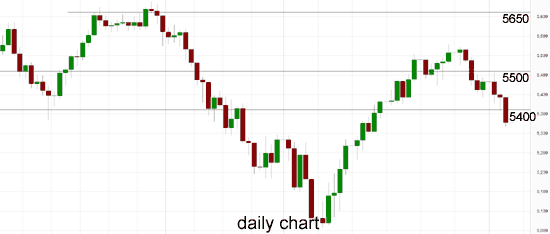
Over the last week or so the Australia 200 index has returned some of its recent gains falling from above 5550 down to a four week low below the support at 5400. Prior to that it had enjoyed a solid resurgence throughout October after getting much needed support from the 5200 level, which has resulted in it moving back above the 5400 and 5500 levels, around a two month high. Throughout most of September the Australia 200 Index declined strongly from its multi-year high after running into resistance around 5650 back to enter its previously established trading range between 5400 and 5500, before falling further below 5200 and to an eight month low around 5120 a few weeks ago. Several weeks ago it received solid support from the 5100 level which saw it rally well to close out a couple of weeks ago. Back in early September the 5400 level was called upon to offer support as the index desperately tried to stay in touch with its range, however it fell through there before rallying strongly back up to 5400. Up until recently, the 5400 level had done well and propped up price to keep it within the range.
In its recent fall at the beginning of August it moved down to a three week low around 5375, however it received solid support at the 5400 level which has allowed to consolidate and rally higher. The solid move higher throughout July saw it move strongly up through both the 5500 and 5550 levels to reach a then six year high around 5620. In recent weeks it has discovered a new key level to deal with after running into a short term resistance level at 5550, which earlier last week provided some solid support. It reversed strongly several weeks ago bringing it back down to almost touch the 5400 level before rallying back higher again. At the beginning of June the Australian 200 Index fell and broke back down through the key 5500 level towards a four week low around 5400 before consolidating and resting on support there for an extended period.
Back at the end of May, it moved back and forth between the two key levels of 5500 and 5550 before the recent fall. Over the last couple of months the Australia 200 Index has formed an amazing attraction to the key 5500 level as it spent a considerable amount of time trading around it. A couple of weeks ago, the index fell away heavily back down to support around 5400 before returning to the key 5500 level just as quickly, as if gravity had pulled it back. The index has done very well over the last couple of years moving from below 4000 to its present trading levels around 5500.
The good news is the Australian economy looks like it’ll be taking a turn for the better next year. The not-so-good news, for borrowers at least, is that the upturn should pave the way for rising interest rates. The latest Westpac/Melbourne Institute Leading Index, which indicates the likely pace of economic activity three to nine months into the future, suggests economic growth will remain below trend into the first half of 2015. But while the index remains in negative territory, it did pick up in October, suggesting the economy could be headed for greener pastures during the June quarter, Westpac chief economist Bill Evans said. Mr Evans said the improved growth outlook suggested by the index was consistent with Westpac’s view of where the economy was headed, driven by expectations of a pickup in consumer spending and non-mining investment in 2015. That would lend support to the labour market, pushing the unemployment rate down through the second-half of 2015 to 5.9 per cent by the end of the year, he said. The pickup would then allow the Reserve Bank to begin hiking interest rates as early as August 2015, he said. “Overall, we expect Australia’s growth rate in 2015 to reach an above trend 3.2 per cent despite a larger drag from mining investment,” Mr Evans said.

Australia 200 November 19 at 22:15 GMT 5366 H: 5431 L: 5356
Australia 200 Technical
| S3 | S2 | S1 | R1 | R2 | R3 |
| 5340 | 5100 | — | 5650 | — | — |
During the hours of the Asian trading session on Thursday, the Australia 200 Index will be trying to find some more support from the 5400 level and look to rally higher and return to above 5500 again. For most of this year the Australia 200 Index has moved well from the lower support level at 5000 up to the multi-year highs above 5600 in September.
Further levels in both directions:
• Below: 5340 and 5100.
• Above: 5650.
Economic Releases
- 09:00 EU Flash Composite PMI (Nov)
- 09:00 EU Flash Manufacturing PMI (Nov)
- 09:00 EU Flash Services PMI (Nov)
- 09:30 UK Retail Sales (Oct)
- 11:00 UK CBI Industrial Trends (20th-25th) (Nov)
- 13:30 CA Wholesale Sales (Sep)
- 13:30 US CPI (Oct)
- 13:30 US Initial Claims (15/11/2014)
- 14:45 US Flash Manufacturing PMI (Nov)
- 15:00 EU Flash Consumer Sentiment (Nov)
- 15:00 US Existing home sales (Oct)
- 15:00 US Leading Indicator (Oct)
- 15:00 US Philadelphia Fed Survey (Nov)
- JP BoJ Publication of Monthly Report
