“AUD GDP q/q: +0.6% v +0.5% expected and +1.1% previously (revised).”
And with that, the Australian economy has officially come aloof from the rest of the world.
Defying economic struggles and uncertainty worldwide, Wednesday’s Australian GDP again printed a stronger than expected +0.6%.
This print will no doubt be a huge relief for the Reserve Bank of Australia who are notorious for their ‘wait and see, ride it out’ approach to monetary policy.
According to Bloomberg swaps data, the probability that the RBA will cut in May has now dropped from 55% to 43%. Unreal turnaround from an almost entirely priced in cut and this is being reflected in the AUD/USD charts:
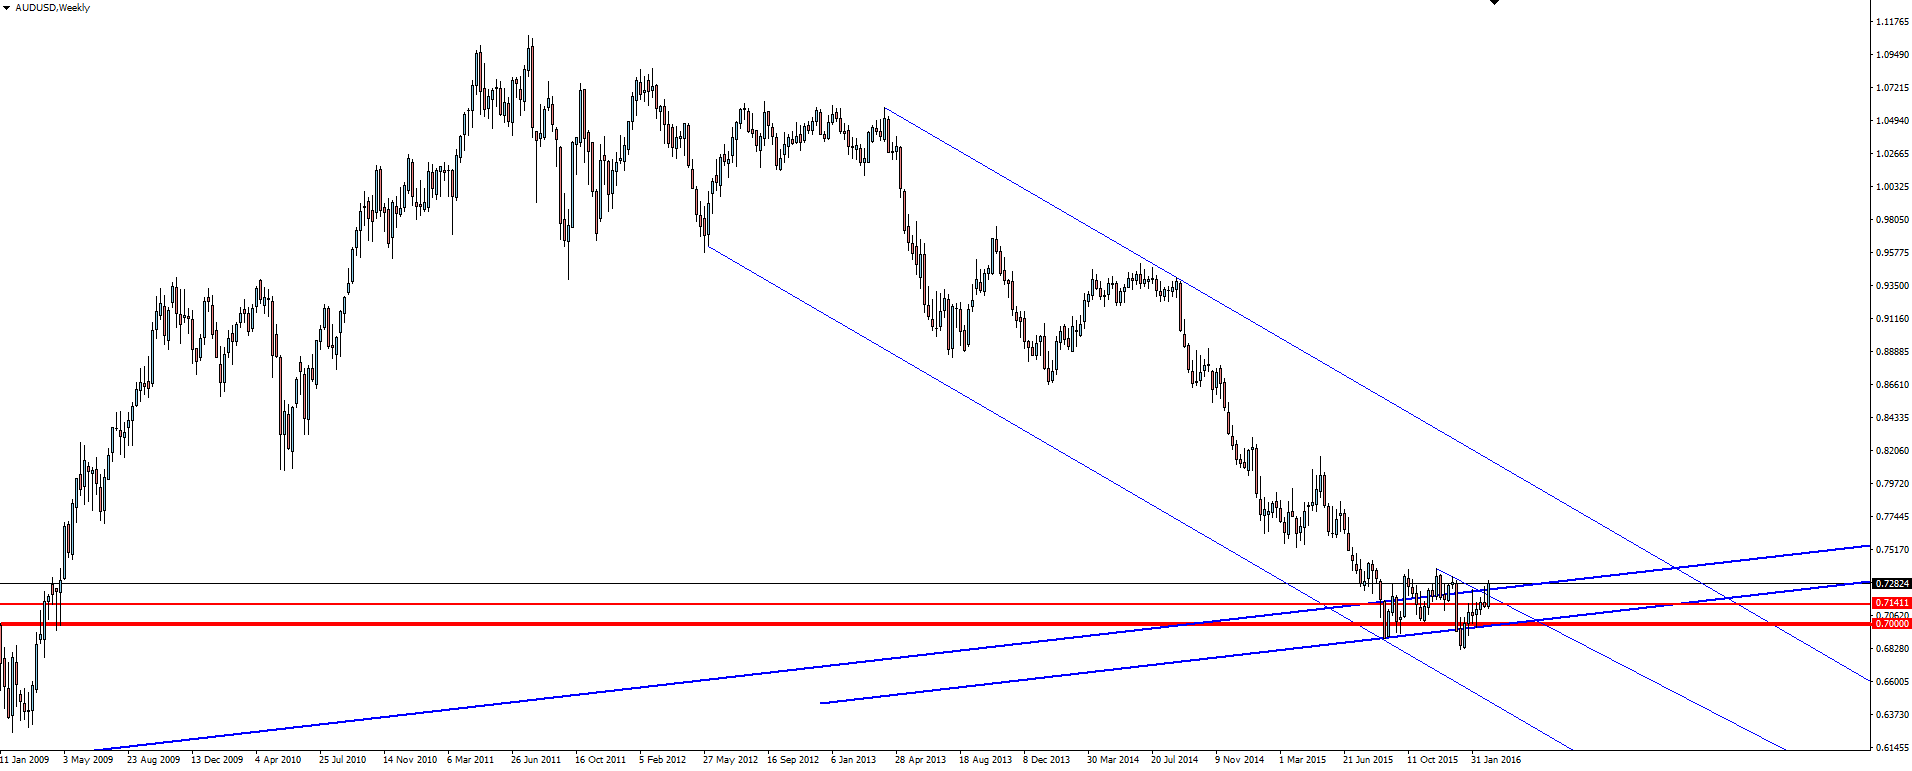
AUD/USD Weekly:
The AUD/USD weekly chart shows the huge support zone that price has come down into and bounced from.
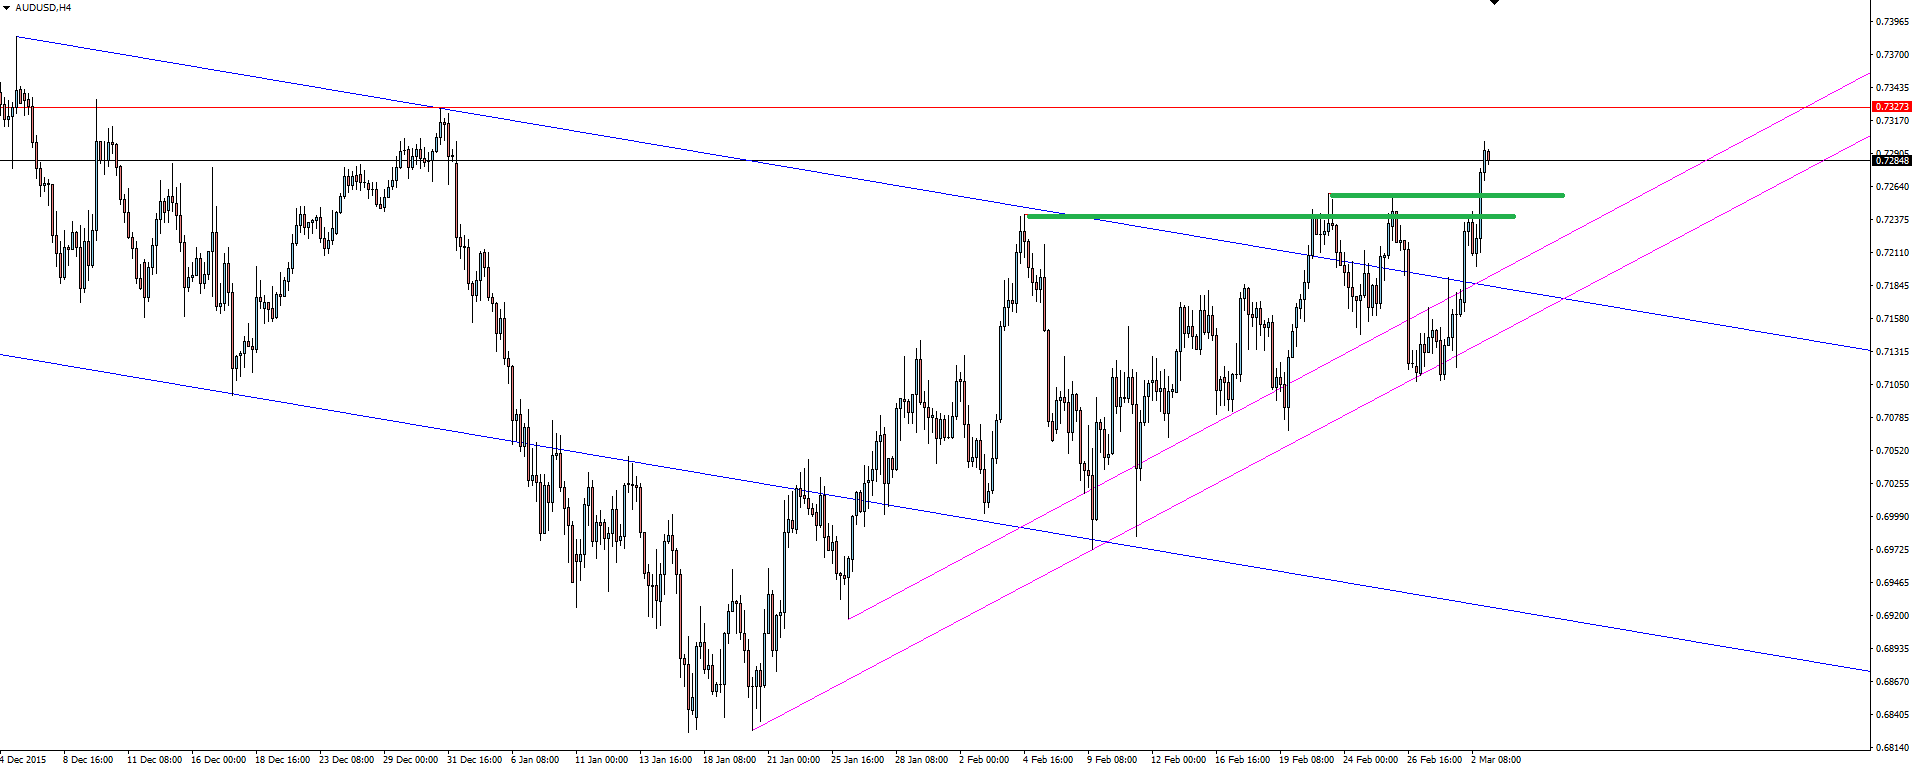
AUD/USD 4 Hour:
Over on the @VantageFX Twitter account, we’ve been looking for a break-out of short term resistance on the 4 hour chart. The market just doesn’t like ‘clean’ levels and once price got some momentum behind it, the level was always going to go.
The Australian economy simply just continues to do what it shouldn’t. In the face of consistently low commodities prices to end 2015, the export dependent Australian economy still managed to grow. With iron ore and other tradable commodities seeing a short term injection of demand recently, everything is just coming together at once for the Aussie dollar which after cracking short term resistance, has gone vertical.
Chart of the Day:
With today’s Australiana theme, we will also give the SPI200 Indices market some deserving attention.
SPI 200 Daily:
First up the daily chart showing a short term bearish trend line breaking out. Price hasn’t printed a higher high or broken out of the marked horizontal support/resistance level that has caused a reaction multiple times in the past, but the lower high (and inverse head and shoulders if you’re really keen!) is promising for a further push to the upside.
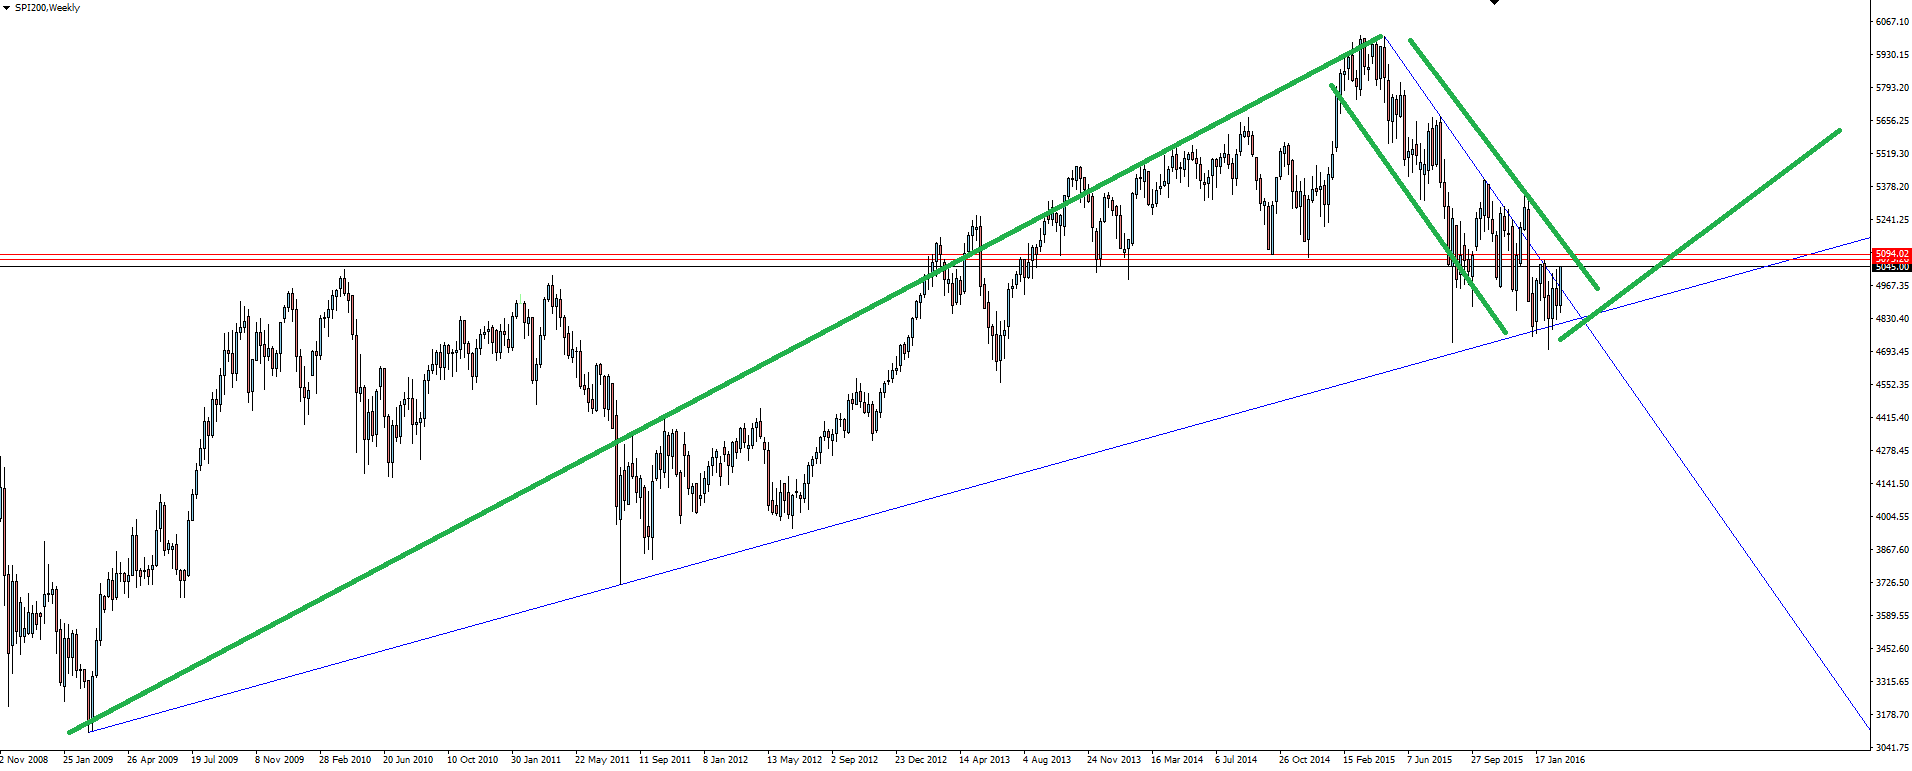
SPI 200 Weekly:
The weekly adds to the bullish bias as well, with price moving up off major weekly trend line support in what looks like a textbook flag pattern back to the trend before a push higher.
Always tell yourself that support holds until it doesn’t. Trade the levels that are in front of you.
On the Calendar Thursday:
AUD Trade Balance
CNY Caixin Services PMI
GBP Services PMI
USD Unemployment Claims
USD ISM Non-Manufacturing PMI
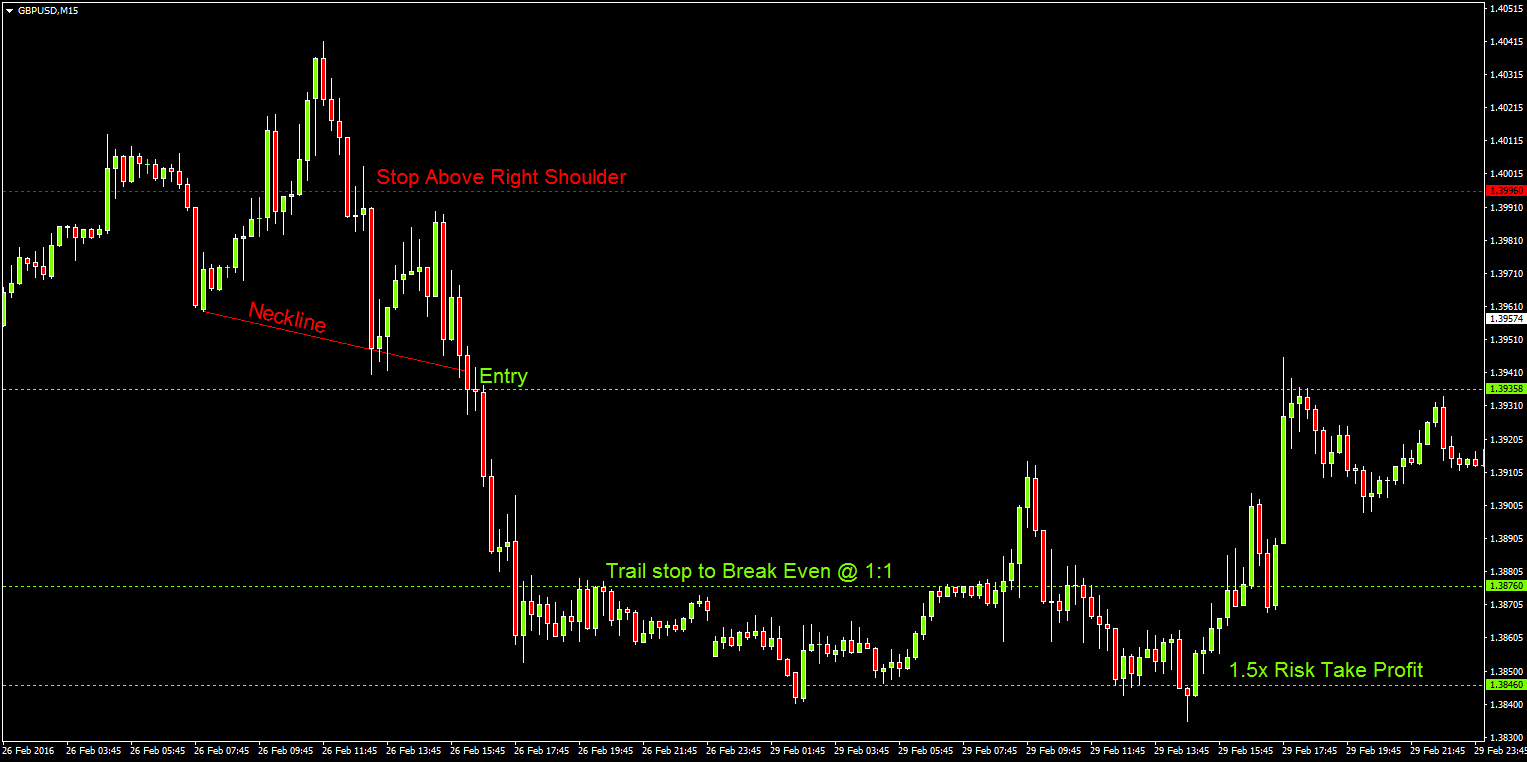
“Over the next 4 weeks I’ll be demo trading a Head and Shoulders Forex strategy on a Vantage FX RAW ECN account and providing regular updates.”
Risk Disclosure: In addition to the website disclaimer below, the material on this page prepared by Vantage FX Pty Ltd does not contain a record of our prices or solicitation to trade. All opinions, news, research, prices or other information is provided as general Forex news and marketing communication – not as investment advice. Consequently any person acting on it does so entirely at their own risk. The experts writers express their personal opinions and will not assume any responsibility whatsoever for the actions of the reader. We always aim for maximum accuracy and timeliness, and Vantage FX shall not be liable for any loss or damage, consequential or otherwise, which may arise from the use or reliance on this service and its content, inaccurate information or typos. No representation is being made that any results discussed within the report will be achieved, and past performance is not indicative of future performance.

