Forex News and Events:
The FX trading is mostly range bound this Wednesday. The Aussie is the biggest winner among G10 versus USD on RBA Stevens brand new indifference to AUD strength; AUD/JPY extends gains to the fresh 2014 high of 94.488 (at the time of writing). In Japan, the hike in sales tax to become effective from April 1st raises questions on whether the BoJ will react to secure the 2% inflation target or no. The Japan government announced plans to spend at least 10 trillion Yen in public works. Globally, the US dollar is likely to step into a strengthening path as Fed Presidents stand behind Yellen’s hawkish plans announced last week. In Switzerland, the franc pares gains yet the softer CHF remains subject to geopolitical risks.
JPY balanced before sales tax, inflation data
The sales tax hike from 5% to 8% will become effective from April 1st in Japan. The uncertainties on potential impacts on inflation dynamics preoccupy the markets. Japan will release February inflation figures on Friday (March 28th). The expectations are flat-to-positive. The nationwide CPI (year-on-year) is expected to accelerate from 1.4% to 1.5%. Any negative surprise is likely to gain traction given higher sales tax in scope. Market attention shifts to BoJ meeting in April, markets expect additional monetary stimulus to protect the 2% inflation target.
On the international platform, Japan’s EconMin Amari informed reporters that Japan and Australia agreed to speed up the Economic Partnership Agreement (EPA) talks before the bilateral summit in April. At this stage, Australia represents roughly 6% of Japan’s total trades, while Japan stands for 20% of Australia’s trades. Although AUD/JPY extended strength to the fresh 2014 high of 94.488, expectations of lower trade barriers should help to keep the appetite on the buy side. The key resistance is placed at Fibonacci 50% of 95.922 on 2013 Fibonacci retracement.
Other major JPY-crosses trade in tight ranges although the Japanese government announced its plans to spend at least 10 trln Yen in public works to offset higher taxes. USD/JPY sees resistance below the daily Ichimoku cloud cover (102.45/103.10). With trend and momentum indicators flat, we keep our marginal positive bias as long as 101.80-102.00 support zone holds. On the upside, the key resistance is placed at 103.00/10 (daily cloud top / optionality).
EUR/JPY trades in a tight range just above the daily Ichimoku cloud cover (139.59/140.96). Given the bearish momentum, we expect the selling pressures to drive the pair into the daily cloud cover. The key short term supply zone is placed at 140.23/54 (50 & 100 dma). On the upside, light option barriers are seen at 141.50, more resistance should come into play at 141.75 (Feb-Mar downtrend base).
UBS Consumption Indicator Improves
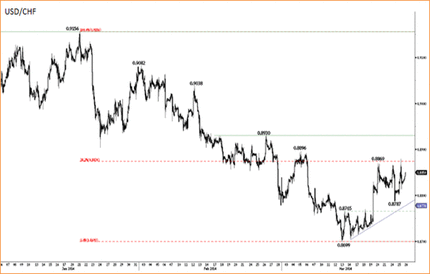
The UBS consumption indicator has been revised from 1.44 to 1.49 in January and is released at 1.57 in February. USD/CHF consolidates gains above the 21-dma (currently at 0.8808). Given the easing tensions in Ukraine and broad based demand in USD (as Fed’s Yellen sees support from other Fed Presidents regarding her hawkish position in policy normalization), trend and momentum indicators in USDCHF gain traction on the upside. Ahead of us, the 50-dma (0.8909) is the next key level before the pair runs into 0.8930-resistance. EUR/CHF broke the 50-dma (1.22159) and rallied to 1.22292 on European bids this morning. The technical picture suggests the extension of gains towards 1.22495 (Fibonacci 50.0% level on Jan-Mar drop). However, we remind that the tensions in Crimea are not over. The softness in Swiss franc remains subject to geopolitical risks.

Today's Key Issues (time in GMT):
2014-03-26T07:00:00 EUR Apr GfK Consumer Confidence, exp 8.5, last 8.52014-03-26T07:00:00 CHF Feb UBS Consumption Indicator, last 1.44
2014-03-26T08:00:00 SEK Mar Consumer Confidence, exp 101.8, last 100.3
2014-03-26T08:00:00 SEK Mar Manufacturing Confidence s.a., exp 104, last 103.8
2014-03-26T08:00:00 SEK Mar Economic Tendency Survey, exp 104.9, last 104.6
2014-03-26T08:30:00 SEK Feb Trade Balance, exp 6.1B, last 5.8B
2014-03-26T09:00:00 EUR Jan Retail Sales MoM, exp 0.10%, last -0.30%
2014-03-26T09:00:00 EUR Jan Retail Sales YoY, exp -1.60%, last -2.60%
2014-03-26T10:00:00 EUR Mar Consumer Confidence Index, exp 98.4, last 97.5
2014-03-26T11:00:00 USD Mar 21st MBA Mortgage Applications, last -1.20%
2014-03-26T12:30:00 USD Feb Durable Goods Orders, exp 0.80%, last -1.00%
2014-03-26T12:30:00 USD Feb Durables Ex Transportation, exp 0.30%, last 1.10%
2014-03-26T12:30:00 USD Feb Cap Goods Orders Nondef Ex Air, exp 0.50%, last 1.70%, rev 1.50%
2014-03-26T12:30:00 USD Feb Cap Goods Ship Nondef Ex Air, exp 0.80%, last -0.80%, rev -1.00%
2014-03-26T13:45:00 USD Mar P Markit US Composite PMI, last 54.1
2014-03-26T13:45:00 USD Mar P Markit US Services PMI, exp 54, last 53.3
2014-03-26T17:00:00 EUR Feb Total Jobseekers, exp 3320.0k, last 3316.2k
2014-03-26T17:00:00 EUR Feb Jobseekers Net Change, exp 2.4, last 8.9
2014-03-26T21:45:00 NZD Feb Trade Balance, exp 600M, last 306M
2014-03-26T21:45:00 NZD Feb Exports, exp 4.44B, last 4.08B
2014-03-26T21:45:00 NZD Feb Imports, exp 3.75B, last 3.77B
2014-03-26T21:45:00 NZD Feb Trade Balance 12 Mth YTD, exp 500M, last 312M
The Risk Today:
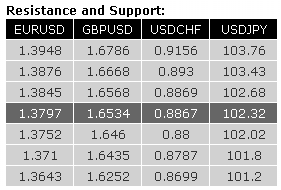
EUR/USD EUR/USD has thus far failed to confirm its move above the resistance at 1.3845 (20/03/2014 high). Monitor the horizontal range defined by the support at 1.3749 and the resistance at 1.3876. Another support stands at 1.3643, whereas another resistance lies at 1.3948 (17/03/2014 high). In the medium-term, the break of the support at 1.3834 (11/03/2014 low, see also the rising channel) coupled with general overbought conditions favour a move lower towards the support at 1.3643. The recent high at 1.3967 is likely to act as a strong resistance.
GBP/USD GBP/USD is bouncing near the support implied by its rising channel. Hourly resistances are given by 1.6568 (see also the declining channel) and 1.6666. Supports can be found at 1.6460 and 1.6252 (05/02/2014 low). In the longer term, a break to the downside out of the rising channel would negate the current bullish bias implied by the break of the resistance at 1.6668 (24/01/2014 high). A strong horizontal support stands at 1.6220 (17/12/2013 low).
USD/JPY USD/JPY is moving sideways after having bounced sharply near the key support at 101.20. The potential symmetrical triangle favours a bullish bias. As a result, monitor the hourly resistance at 102.68, as a break would confirm a second upleg towards the resistance at 103.43. Hourly supports lie at 102.02 (21/03/2014 low) and 101.94 (previous resistance). A long-term bullish bias is favoured as long as the key support area given by the 200 day moving average (around 100.48) and 99.57 (see also the rising trendline from the 93.79 low (13/06/2013)) holds. A major resistance stands at 110.66 (15/08/2008 high).
USD/CHF USD/CHF is moving sideways between the support at 0.8787 (see also the rising trendline) and the resistance at 0.8869 (see also the 38.2% retracement). The short-term rising trendline favours a bullish bias. Another key resistance can be found at 0.8930 (26/02/2014 high). From a longer term perspective, the structure present since 0.9972 (24/07/2012) is seen as a large corrective phase. A break of the resistance at 0.8869 is needed to improve the medium-term technical structure.

