Summary: The latest data from the Federal Reserve and ICI, a company that measures equity money flows, show that US households have been aggressively adding to their equity exposure and reducing their cash. As the bull market has matured and investor confidence has increased, money has increasingly flowed to foreign equity markets, especially in 2015.
* * *
The latest Federal Reserve flow of funds data (Z1) provides an up to date view of households' current asset allocation. Let's review.
Household's largest holding continues to be in equities; these comprise about 31% of their total financial assets. Current levels are above the recent highs of 29% in mid-2007; it reached an all-time high of 36% in 2000. In short, as the bull market has matured, households have become comfortable holding equities.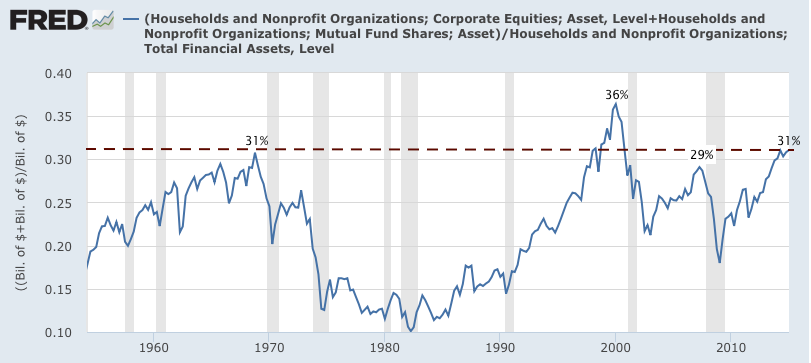
Treasury, corporate and muni bonds are about 19% of household financial assets. Current levels are near the most recent bottom of 18% in 2000 and also near their lowest level in 35 years. This asset class is not in favor with households.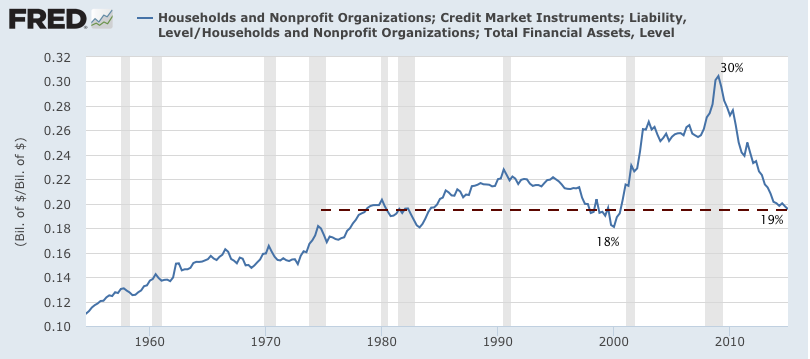
Checking, savings deposits and money market funds (cash) are about 15% of household financial assets. They peaked at 18% in early 2009. Current levels are near the most recent bottom of 14% in mid-2007; it reached an all-time low of 12% in 2000. On a longer timeframe, current cash holdings are among the lowest of the past 60 years.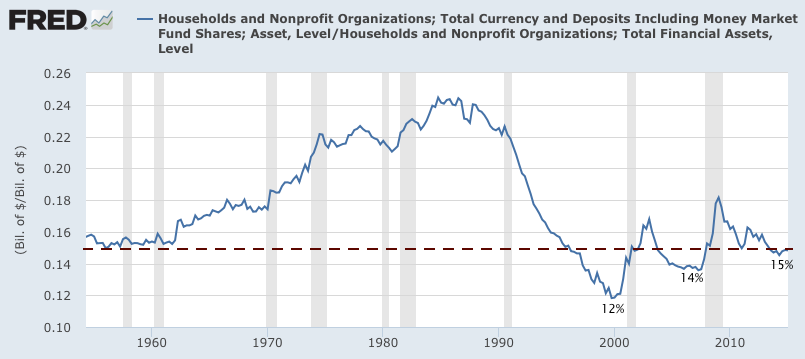
Households have a number of ways of investing in equities: through ETFs, mutual funds or individual securities, to name three. As the data above show, investors currently have a significant preference for equities relative to cash.
In fact, their holdings of equity ETF and mutual funds relative to money markets has reached a substantial new high. There has been no let-up in this trend so far in 2015 (data through end of April; data from ICI via Sentimentrader).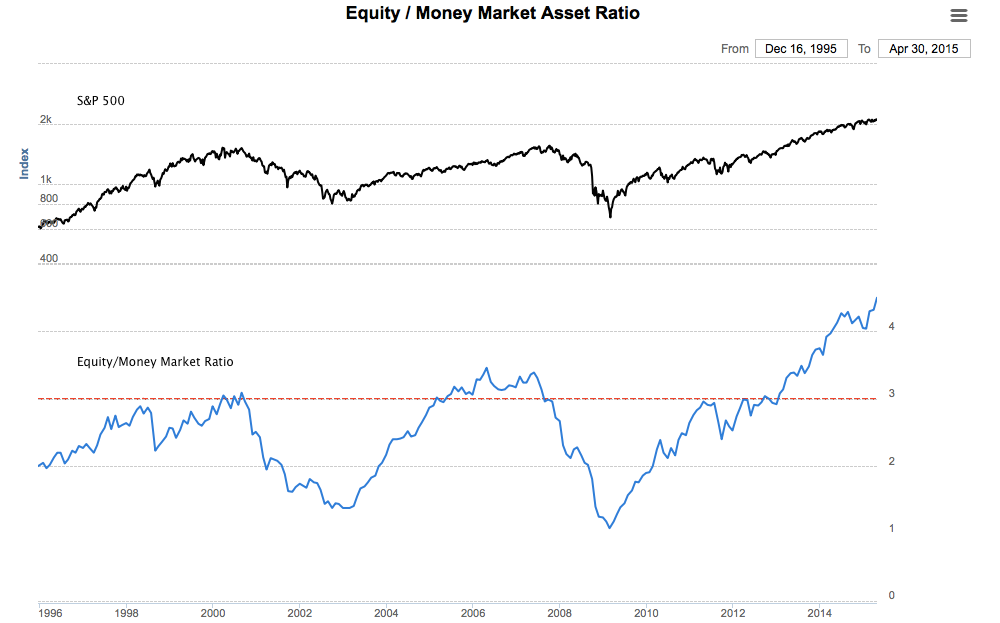
Importantly, these figures do not just reflect appreciation in asset values. Investors have actively added to their equity exposure through ETFs and mutual funds; the figures below show inflows through April (data from ICI via Yardeni).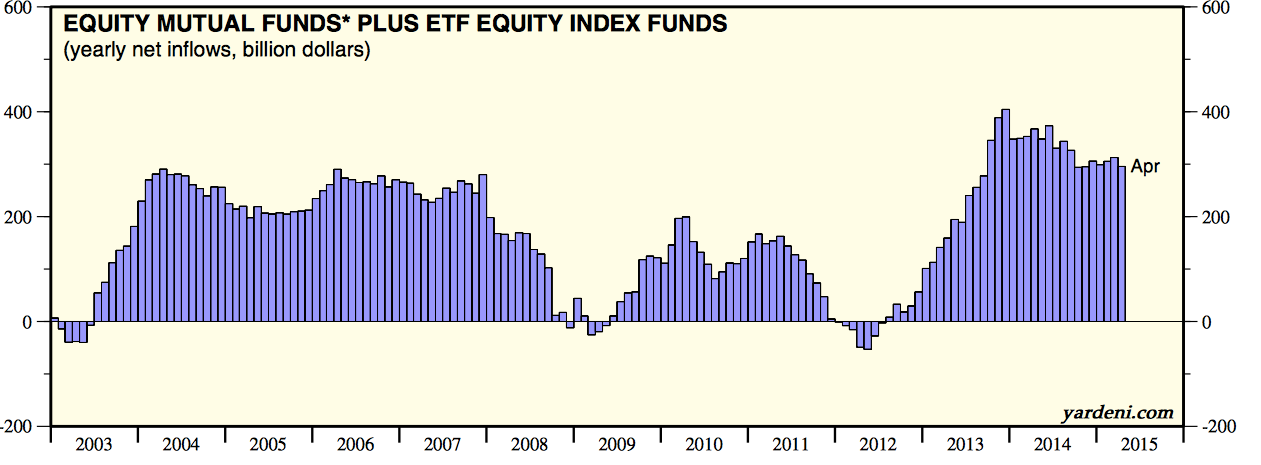
Until recently, equity ETF and mutual fund flows were skewed heavily to the US markets. There was a boom in inflows from late 2012 to the end of 2014. That has cooled so far in 2015, coinciding with US indices largely trading sideways (data from ICI and Morning Star, through the end of May).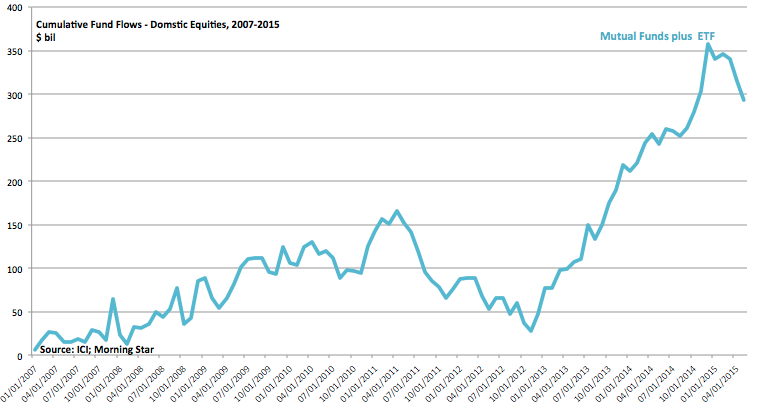
It's important to remember that these figures only include funds; with the maturation of the bull market, investors might well be increasing their direct ownership of individual stocks at the expense of funds.
There has also been a switch in 2015 to ex-US equity funds. Investors have been increasing their exposure to foreign markets through mutual funds for several years, and that has continued strongly into 2015 even as US flows have eased.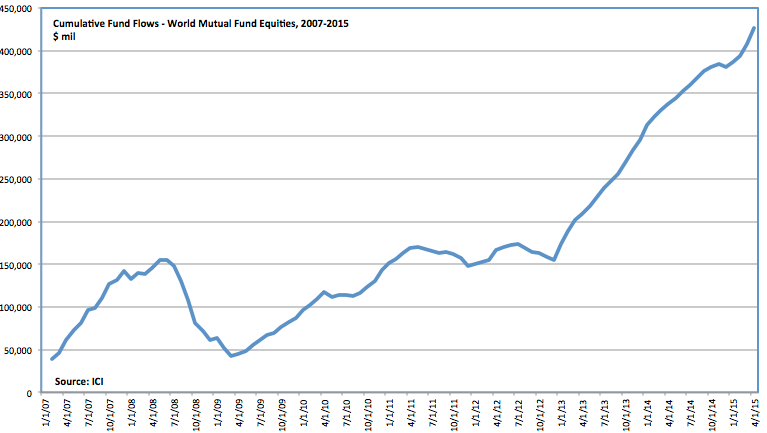
We looked at how fund flows were changing once before (here). As a reminder, domestic equity ETFs have been growing their inflows at the expense of mutual funds for many years.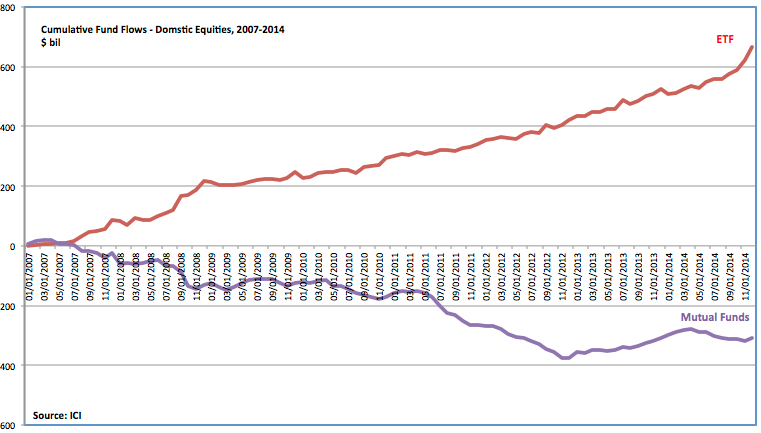
Behind this trend is the indexation of investing in the US market: the loss of inflows in mutual funds is concentrated in "active" mutual funds where a fund manager picks stocks. In their place are "index" mutual funds that, like ETFs, invest passively in the S&P 500, the Dow and other indices.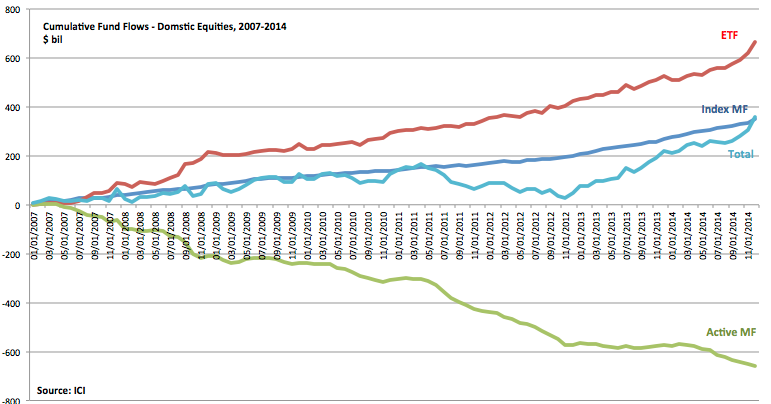
US households hold a very high proportion of their assets in equities. Their cash holdings are relatively low. As the bull market has matured and investor confidence has increased, there has been a concurrent increase in investors' preference for investing in foreign markets, and this in part explains why US fund flows have cooled so far in 2015.
- English (UK)
- English (India)
- English (Canada)
- English (Australia)
- English (South Africa)
- English (Philippines)
- English (Nigeria)
- Deutsch
- Español (España)
- Español (México)
- Français
- Italiano
- Nederlands
- Português (Portugal)
- Polski
- Português (Brasil)
- Русский
- Türkçe
- العربية
- Ελληνικά
- Svenska
- Suomi
- עברית
- 日本語
- 한국어
- 简体中文
- 繁體中文
- Bahasa Indonesia
- Bahasa Melayu
- ไทย
- Tiếng Việt
- हिंदी
At Mid Year, Here's How Investors Are Positioned
Published 06/12/2015, 02:02 PM
Updated 07/09/2023, 06:31 AM
At Mid Year, Here's How Investors Are Positioned
Latest comments
Install Our App
Risk Disclosure: Trading in financial instruments and/or cryptocurrencies involves high risks including the risk of losing some, or all, of your investment amount, and may not be suitable for all investors. Prices of cryptocurrencies are extremely volatile and may be affected by external factors such as financial, regulatory or political events. Trading on margin increases the financial risks.
Before deciding to trade in financial instrument or cryptocurrencies you should be fully informed of the risks and costs associated with trading the financial markets, carefully consider your investment objectives, level of experience, and risk appetite, and seek professional advice where needed.
Fusion Media would like to remind you that the data contained in this website is not necessarily real-time nor accurate. The data and prices on the website are not necessarily provided by any market or exchange, but may be provided by market makers, and so prices may not be accurate and may differ from the actual price at any given market, meaning prices are indicative and not appropriate for trading purposes. Fusion Media and any provider of the data contained in this website will not accept liability for any loss or damage as a result of your trading, or your reliance on the information contained within this website.
It is prohibited to use, store, reproduce, display, modify, transmit or distribute the data contained in this website without the explicit prior written permission of Fusion Media and/or the data provider. All intellectual property rights are reserved by the providers and/or the exchange providing the data contained in this website.
Fusion Media may be compensated by the advertisers that appear on the website, based on your interaction with the advertisements or advertisers.
© 2007-2024 - Fusion Media Limited. All Rights Reserved.
