We track eight country indices in the Asian group. Generally they all bottomed around 2008/2009, surged higher into 2010/2011, corrected, and then most turned quite choppy. A few in the group emerged out of the choppiness and actually started impulsing after beginning EQE or a change in government. We will cover them first.
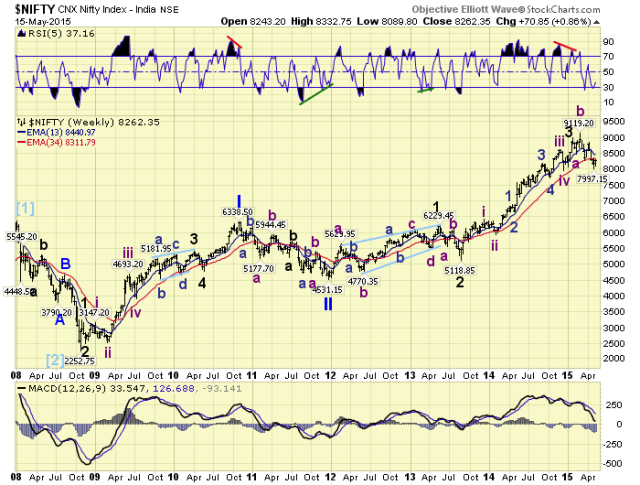
India’s Nifty made a bear market low in 2008. After a rally nearly back to the 2007 high, at 6357, in 2010 it corrected into 2011. At first we had a difficult time deciphering an impulse wave from 2008-2010. However, after diagonal triangles started appearing in many markets, worldwide, we found that it was indeed a bullish rise. Making things even more difficult the Nifty started Primary III with about an 18 month diagonal triangle Major wave 1. Then after an a-b-c Major wave 2, it started seriously impulsing in Major wave 3. Currently we have the Nifty in an irregular Major wave 4, which may have bottomed around 8000 or should bottom around 7700.
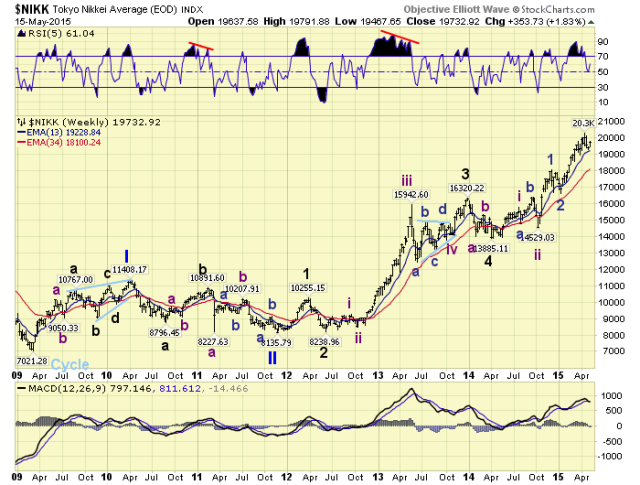
Japan’s Nikkei 225 had even a worse beginning from its 2009 low: a diagonal triangle Primary I into early-2010. Then it spent about 18 months correcting in a complex Primary II. Only when Primary III began this index start really impulsing. Then after simple Major waves 1 and 2, it went into a subdividing Major 3 and more complex Major 4. Currently it is in a subdividing Major 5. Still a long way from the 1989 38,900 all time high. But if it can clear the secondary high at 22,800 in 1996 it could reach it during this bull market.
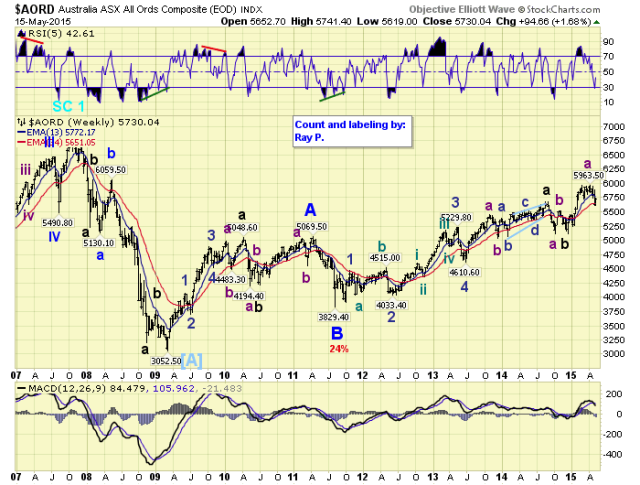
Australia’s ASX All Ordinaries made an all time high in 2007 at 6873. After that it fell with most of the world’s indices into a 2009 low at 3053. The advance off that low into 2011 was a bit choppy and we labeled it a Primary A. After a Primary B decline into a 2011 low, we have been tracking this four year advance as a Primary C. However, it is possible, due to the extreme choppiness in most of the Asian indices, for a more bullish count. A Primary I high in 2010, then an irregular Primary II low in 2011 like some other foreign indices, and Primary III under way from the low. Either way the long term trend is up from 2011, and the all time high appears to be within reach.
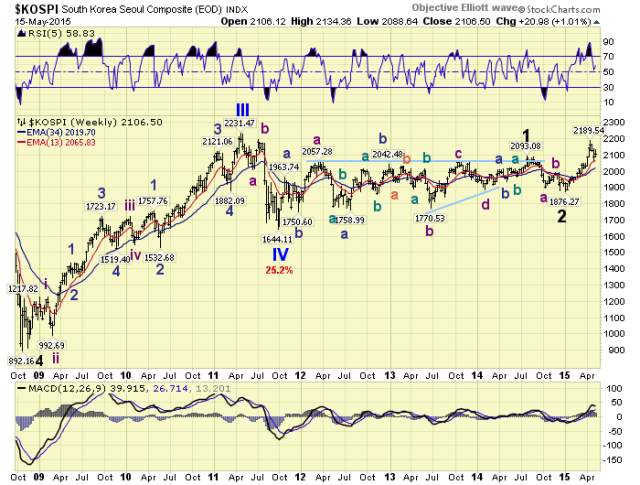
S. Korea’s KOSPI is on a long term count that is quite different than many of the International indices. From a 1998 Cycle [2] low, post the Asian currency crisis, this market has progressed in five Primary waves, with Primary waves III and IV completing in 2011. After that low the KOSPI remained in a trading range for three years. Which appears to have been a large diagonal triangle Major wave 1. After the early-2015 low, Major 2, the KOSPI broke out of the trading range with one solid uptrend. It appears that Major wave 3 of Primary wave V has just begun. New highs should be easily achieved in the coming months.
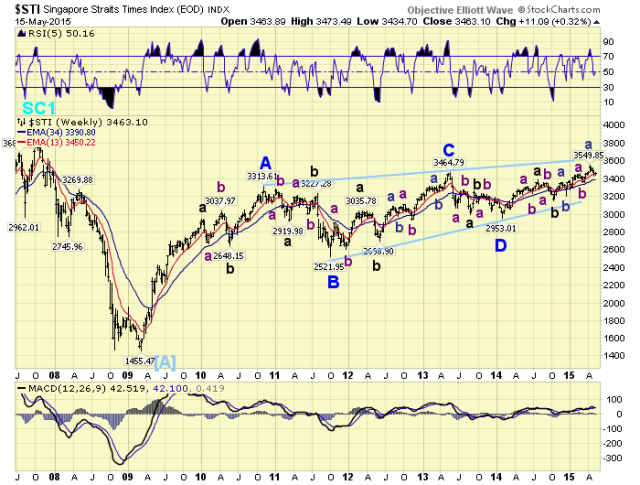
Singapore’s SSTI, and the indices to follow, display extreme choppy activity over the past several years. As a result it is quite difficult to determine exactly what long term pattern they are displaying. Nevertheless, we will give it our best shot from the data currently available. The STI made an all time high in 2007 at 3906. After the sharp decline to 1455 by 2009 it had a very strong advance to 3314 by 2010. After that it has been in a very choppy drift up mode for the past four plus years. While the 2009-2010 surge was quite strong it looks like an a-b-c. In fact, all the activity since then looks like a-b-c’s as well. We are labeling its bull market as a huge Cycle wave [B] diagonal triangle which is yet to complete. When it does, it is likely to experience a drop back to the 2009 lows.
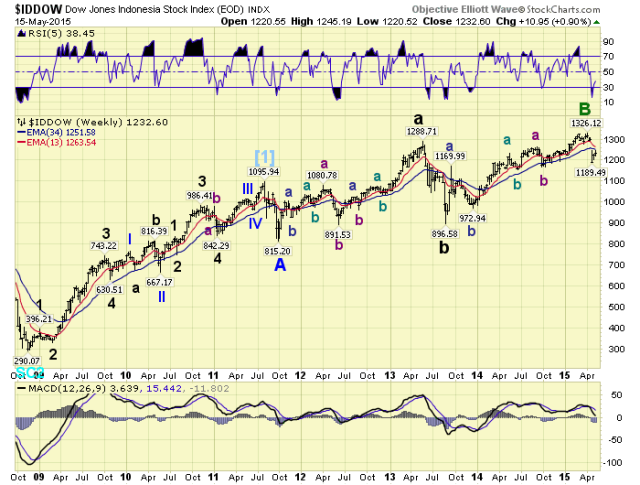
Indonesia’s IDDOW, has another complex long term wave pattern. From its 2008 bear market low it rallied in five waves to all time highs at 1096 by 2011. Then after a decline into a 2011 low the market activity became quite choppy. We have labeled the 2011 low as a Primary A, then the three wave advance to the recent 2015 high as a Primary B. It would appear, unless the current Major wave C extends, that this index should be heading back down to the 2011 lows.
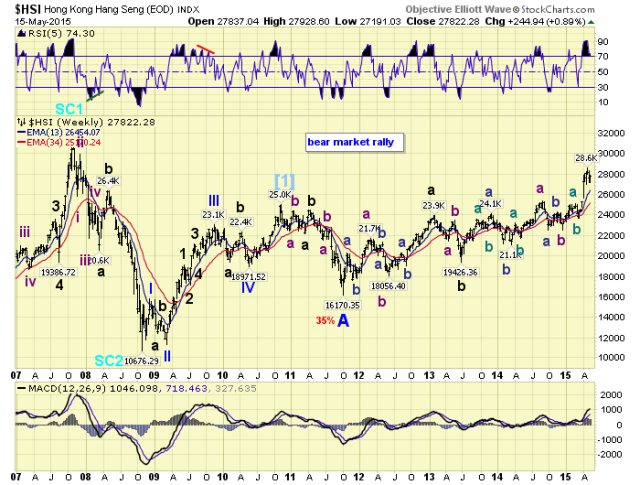
Hong Kong’s HSI has a similar pattern. From its 2008 bear market low it advanced in five waves to a 2010 high. It then corrected into a 2011 low, but has been rising in a very choppy pattern ever since. We believe when its current Primary wave B advance concludes it too should drop back to its 2011 lows.
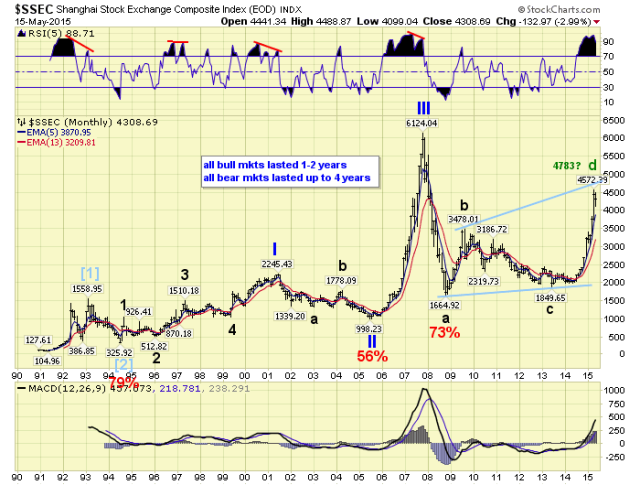
We saved China’s SSEC for last due to the recent complexity of its long term pattern. This planned economy does not appear to have been planned very effectively over the past decade. From 1991-2005 the SSEC moved in a predictable impulse pattern. Then within three years it spiked up six-fold, and then lost 73% of that advance. The selloff ended in 2008 and the market rallied into 2009. But just as most of the world’s markets were doubling into 2013, the SSEC was declining. Then over the past year it has gone into spike up mode again. From an OEW perspective, this market looks fine into the 2007 Primary III high. The selloff into the 2008 low overlapped Primary wave I, suggesting a Primary IV triangle was underway. During fourth wave triangles the internal waves of the triangle can overlap the previous first waves, as long as the triangle ends above the first wave. Normally fourth wave triangles accomplish this by being contracting triangles. This one, however, appears to be an expanding triangle: wave d higher than wave b. We have calculated a potential wave d high at 4783 (d = 1.618 b). This should be followed by an e wave lower to complete the Primary IV triangle above 2245, the high of Primary I. Then Primary V should begin to all time new highs.