US markets have provided Asia with very little to work with, which is not surprising given the Yom Kippur holiday. Volumes through the S&P 500 were 26% below the 30-day average and as such, we can effectively write the session off.
Fresh catalysts for volatility come into the fray as we enter the business section of the week, with Federal Reserve Chair Janet Yellen giving a speech on ‘Inflation Dynamics and Monetary Policy’ at 7.00am AEST. This is also significant, as it is in the twilight hour and in-between the US close and Asia open. Will she provide new information that could see the markets implied probability increase from the current level of 42%? With this level of pricing, the Fed will not raise this year and would much rather she had the probability closer to 70%.
Keep in mind that 4-week US T-bills (perhaps the most of defensive of risk-free assets) moved deeper into negative territory, with its implied yield at -3bp. Negative yields are not thematic of a central bank about to penalise commercial and investment banks for holding funds on the Fed’s balance sheet (imposing negative deposit rates like we are seeing in Europe and Switzerland), but it does suggest a market that is still very much risk averse. It also reflects a supply issue as well, as there just aren’t enough around for the demand, given its use as collateral in the banking sector.
European trade has been modestly upbeat with the bulk of the flow centred on Volkswagen (XETRA:VOWG) who traded in a lazy 22% range. EUR/USD found buyers on a slightly less dovish speech from Mario Draghi, but it seems the market is happy to sell into the $1.1200 area, with a view to add to short positions on a closing break of $1.1100 and the 3 September lows.
Turning to the Australian market
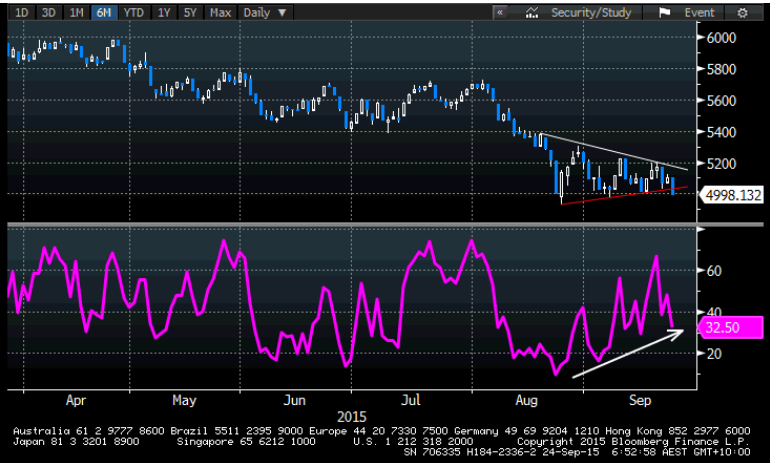
We suggested that the S&P/ASX 200 could be best range traded earlier in the week, with the local market oscillating in a range of 5000 to 5200 since late August and this seems to be appropriate for now. There is some focus on the close through the rising uptrend (drawn from the August low) yesterday and this will often result in a continuation of the prevailing medium-term trend, which is clearly lower. So a firm break of 5000, and the bottom of the recent range would suggest a fairly quick move to the 2011 uptrend at 4850.
In saying that, today’s opening call on the ASX 200 suggests the index should see some modest upside at 5022. BHP should optimise the broader open with a gain of 0.5% (given its American Depository Receipt), with ANZ also looking to open a touch firmer. It’s also interesting to see a series of higher highs and lows in the level of companies trading above the short-term 20-day moving average (see below), which is widely known as an uptrend and shows that the market internals are warming somewhat. The bulls will take whatever scraps of positivity they can get right now.
(The lower pane shows the % of companies above their 20-day MA)

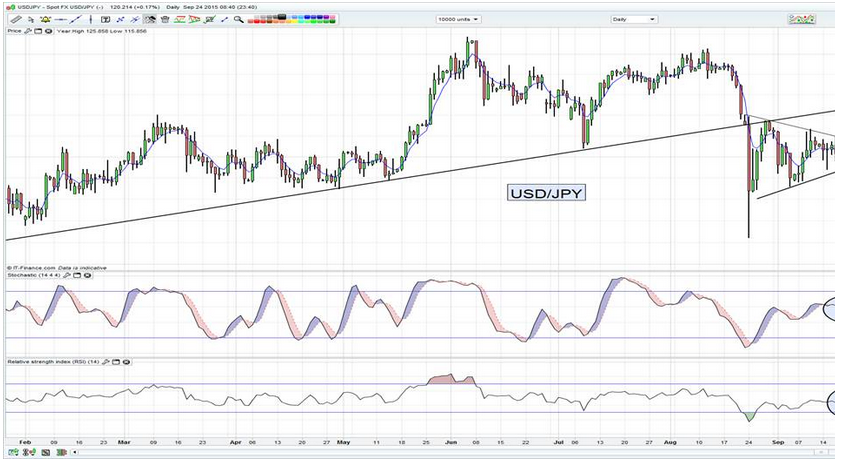
Japan is back online today and likely to fall around 2%, but most of the focus (if looking at Japanese assets) is on USD/JPY. The daily chart shows indecision from traders and a strong missing catalyst for future direction. We can see that in the triangle pattern and also the various oscillators (stochastics and RSI), which are all perfectly neutral. There is no such thing as a textbook ‘fair value’ in the FX market (it is everyone’s own interpretation based on their own modelling systems), but USD/JPY is about as close to ‘fair value’ as you will see. That could soon change though, but we will need to see the implied probability of a December hike alter materially.

Staying in FX land, we have seen good selling in AUD/JPY and the daily chart is showing an emerging double top, with the neckline at ¥82.12. That is still someway off though, with spot at ¥84.18 (at the time of writing), but a future break of this level should be on the radar as it would suggest strong downside. AUD/USD traded with a six handle as the big figure in late US trade and is oscillating around the 70 level as I write. Judging by the falls seen in the various oscillators, it seems the path of resistance is lower. While good bids are seen at $0.7000, a break here would see the recent lows come into play. There is a lack of domestic catalysts for the AUD today, so all eyes should fall on Pool A and the fact Australia failed to pick up the bonus point against Fiji. England vs Wales on the weekend will be huge.
On the commodity front, we have seen spot iron ore fall 1.6%, although the Dalian iron ore futures fell a modest 0.3% in overnight (electronic) trade and this is probably the more influential lead. Copper rallied to a high of $2.32 p/lb (+1.2% on the day), but has given up the gains and is effectively flat from the ASX 200 cash close. However, the mover once again has been the energy complex, with WTI oil falling 3.2% from 4.00pm AEST. Looking at the daily chart it seems $44.00 is the key line in the sand and a break here would suggest stronger downside and a likely trigger for fresh shorts in oil plays and oil currencies (CAD and NOK).
