We all know the stock market tends to move higher over time and, therefore, being a long-term bear is a challenging stance. However, there are times in which the risk of being a bull outweigh the risk of being a bear, and we think this is one of those times.
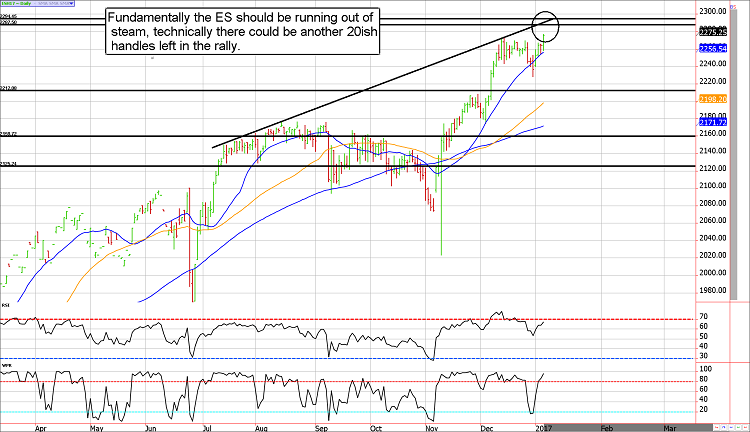
According to our charts the S&P 500 futures could, and probably will, test resistance near 2285 and possibly as high as 2295. However, it is difficult to imagine prices traveling beyond these levels. At some point, probably sooner rather than later, the S&P could run out of buyers. This is generally what happens when market participants get too bullish. After all, if the majority of traders and investors are bullish they have probably already taken action.
Corroborating the premise that the market is "too bullish" and, therefore, "too long" are both the AAII Sentiment Survey and the Consensus Bullish Sentiment Index which suggest investor optimism is at an extreme. According to the American Association of Individual Investors, 46% of those polled are bullish and only 25% are bearish (the remaining are neutral). To put this into perspective, the historical average is 38% and 30%, respectively.
Similarly, the Consensus service suggests 74% of participants are bullish. A reading of 75% or higher is considered to be extreme.
Treasury Futures Markets

We are bullish Treasuries, but can't chase prices higher
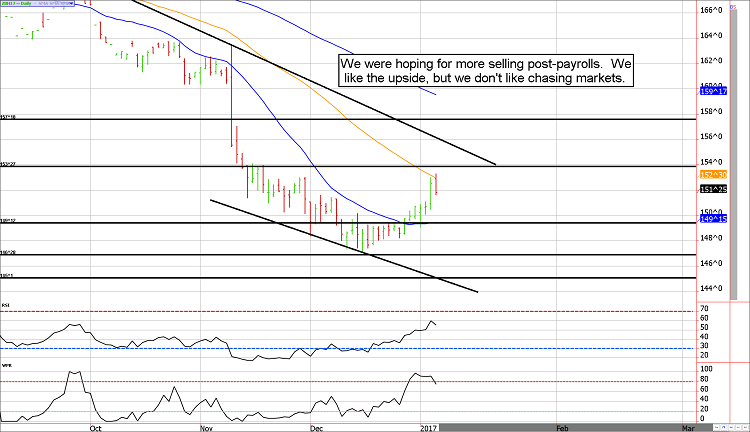
We'll keep this section brief because there isn't a lot more to say other than the path of least resistance, in the long run, is likely higher but the short-term picture is questionable. As bulls, we'd love to see bonds and notes give back some of the rally so traders can establish positions from better levels. Chasing Treasuries higher is a tough game.
Treasury Futures Market Analysis
**Bond Futures Market Consensus:** Resistance overhead, look for another round of selling to get bullish.
**Technical Support:** ZB : 149'12, 146'28 and 154'01 ZN: 123'23, 122'20 and 122'07
**Technical Resistance:** ZB: 153'09, 154'10, and 157'18 ZN: 125'01, 125'21, and 127'28
Stock Index Futures Markets

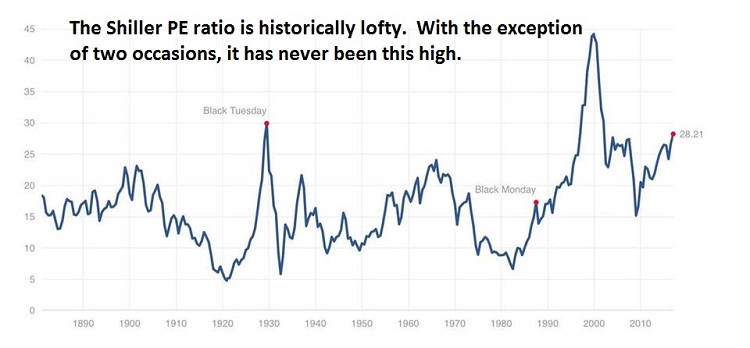
Shiller PE is waving red flags
The Shiller PE created by Robert Shiller is a price to earnings ratio based on average inflation-adjusted earnings. Some sources refer to this as the Cyclically Adjusted PE Ratio or the PE 10. Regardless of the title used, it paints a picture of a potentially overheated market. According to this measure, the market has only been more overheated on two other occasions in history; the 1999/2000 dotcom boom and the late 1920s rally prior to the '29 crash.
The current Shiller PE reading is 28.19; during the late 90s it reached the low 40s and prior to the Black Tuesday crash it saw 30 but in all other occasions the ratio peaked. If history is our guide, this market is in store for a sharp reversal or an astonishing rally.
We are leaning toward the former, but wouldn't recommend betting the farm. We are playing it with the purchase of cheap deep-out-of-the-money put options. This strategy allows traders to have a foot in the door with low and limited risk.

Stock Index Futures Market Ideas
**e-mini S&P Futures Market Consensus:**
We tend to be short-term bearish but the charts are no longer overbought so there is room for another round of buying. Stay tuned...
***We are now charting the March contract!**
**Technical Support:** 2212 and 2159
**Technical Resistance:** 2286 and 2294
e-mini S&P Futures Day Trading Ideas
**These are counter-trend entry ideas, the more distant the level the more reliable but the less likely to get filled**
ES Day Trade Sell Levels: Let's see what Monday looks like
ES Day Trade Buy Levels: Let's see what Monday looks like
In other commodity futures and options markets....
June 23 - Go long corn futures near 392 using mini contracts (the beginning of a scale trade). Full-sized contracts can be used if available margin and risk tolerance is appropriate.
June 30 - Buy September mini (or full-sized) wheat near $4.47.
July 5 - Add to the long mini corn (or full sized) near $3.45.
July 14 - Sell the corn add-on near 370 to lock in a profit (hold the original entry).
July 29 - Buy mini corn future near $3.33 to average entry cost lower.
July 29 - Buy mini wheat to add to our long and adjust the average position entry to $4.25ish.
August 18 - Sell half of the mini wheat position to lock in a profit of about 20 cents on the add-on contract. We'll hold the original
position in hopes of a continued upswing.
October 6 - Buy March Euro strangles using the 123 calls and the 100 puts for about $400. This trade is looking for a sharp increase in volatility.
October 27 - Liquidate half of the corn position, which was added near $3.33 to lock in a profit of about 20 cents.
November 14 - Sell March Euro 100 put for about 41 ticks to lock in $250 to $300 per contract. We are still holding the long call half of the strangle, which is under water.
December 8 - Sell the January S&P 2290 call for about 10.00.
December 13 - Sell the January S&P 2330 call for about 10.00.
December 16 - Buy back the January S&P 2330 calls for about 4.00 to lock in a quick profit.
January 3 - Buy back January S&P 2290 calls to lock in a profit of about $300 per lot before transaction costs.
January 6 - Buy March ES 2025 puts for about 7.50 in premium ($375).
**There is substantial risk of loss in trading futures and options.** These recommendations are a solicitation for entering into derivatives transactions. All known news and events have already been factored into the price of the underlying derivatives discussed. From time to time persons affiliated with Zaner, or its associated companies, may have positions in recommended and other derivatives. Past performance is not indicative of future results. The information and data in this report were obtained from sources considered reliable. Their accuracy or completeness is not guaranteed. Any decision to purchase or sell as a result of the opinions expressed in this report will be the full responsibility of the person authorizing such transaction. Seasonal tendencies are a composite of some of the more consistent commodity futures seasonals that have occurred over the past 15 or more years. There are usually underlying, fundamental circumstances that occur annually that tend to cause the futures markets to react in a similar directional manner during a certain calendar year. While seasonal trends may potentially impact supply and demand in certain commodities, seasonal aspects of supply and demand have been factored into futures & options market pricing. Even if a seasonal tendency occurs in the future, it may not result in a profitable transaction as fees and the timing of the entry and liquidation may impact on the results. No representation is being made that any account has in the past, or will in the future, achieve profits using these recommendations. No representation is being made that price patterns will recur in the future.
