The alternate scenario still has life, but we need to see some downward progress next week. Silver is closest to breaking down, and it may bring gold and miners with it.
The dollar is key. If it finds a near-term bottom and begins rallying, we could get our "Buy Zone" move lower in metals and miners.
-US DOLLAR- I think the dollar is close to a bottom. It might push a little lower next week, but I'm expecting it to establish support around 93.50. If prices in fact bottom, either now or next week, I will look for a rally back to the trendline for starters.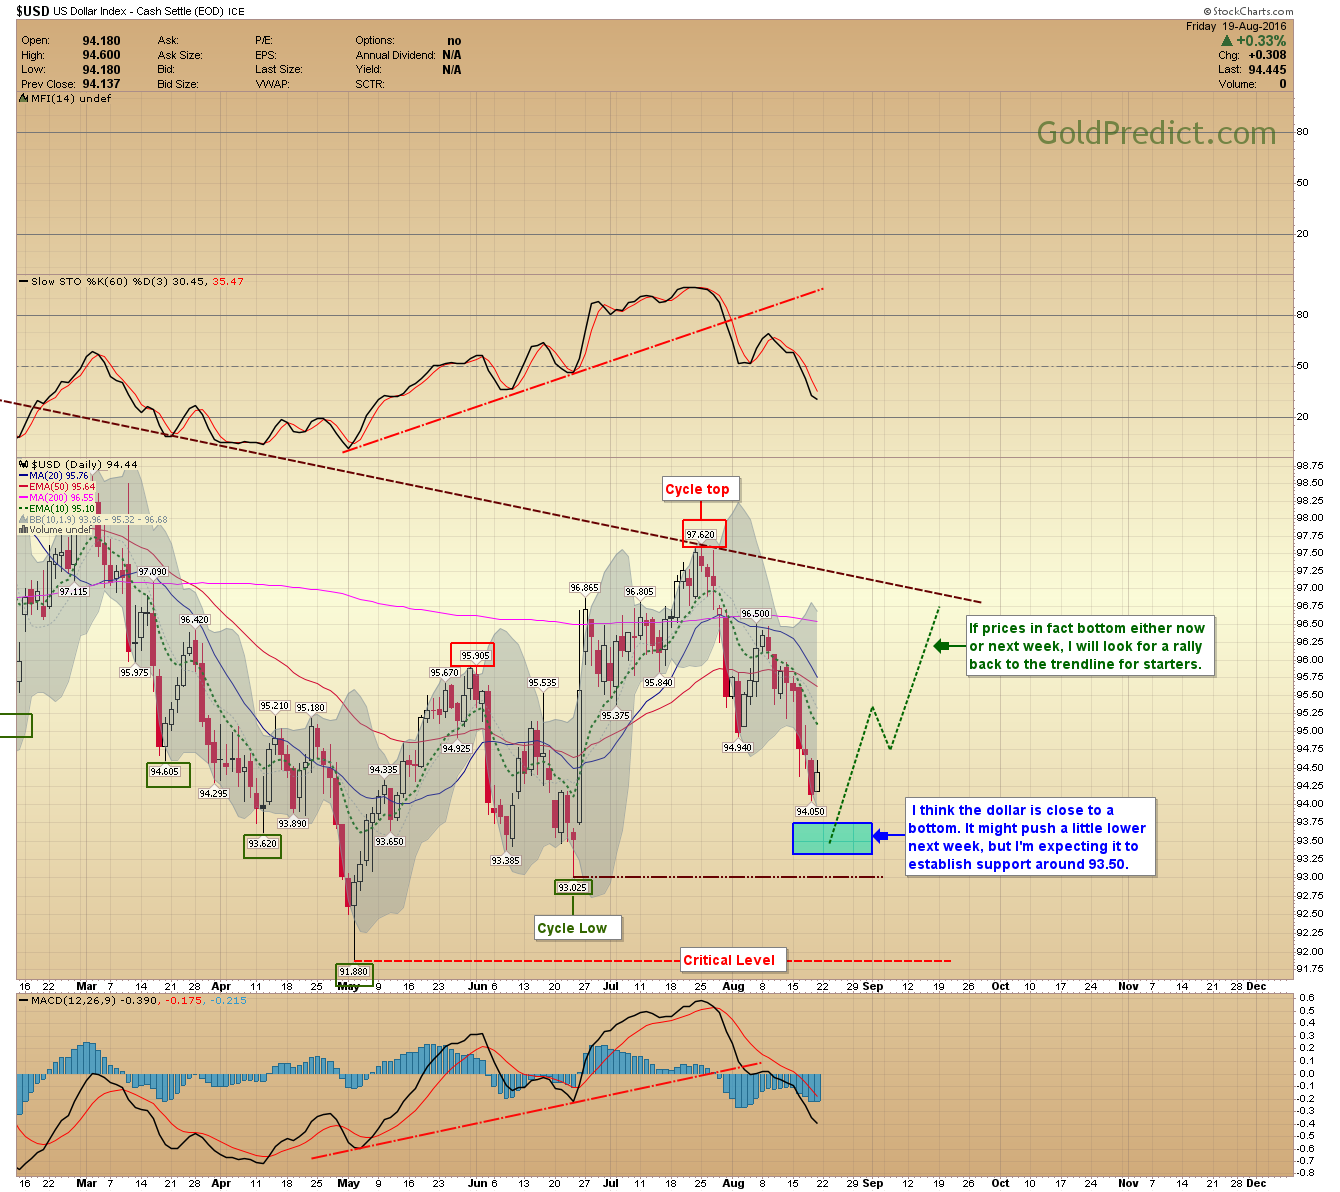
-Gold Weekly- If prices are unable to drop below the $1,310 low then this is just a complex continuation pattern. If that's the case, then once the pattern fills there should be an upside breakout to the lower aspect of the initial target area. IMPORTANT: Prices must break below the $1,310 low in gold for the alternate "Buy Zone" scenario.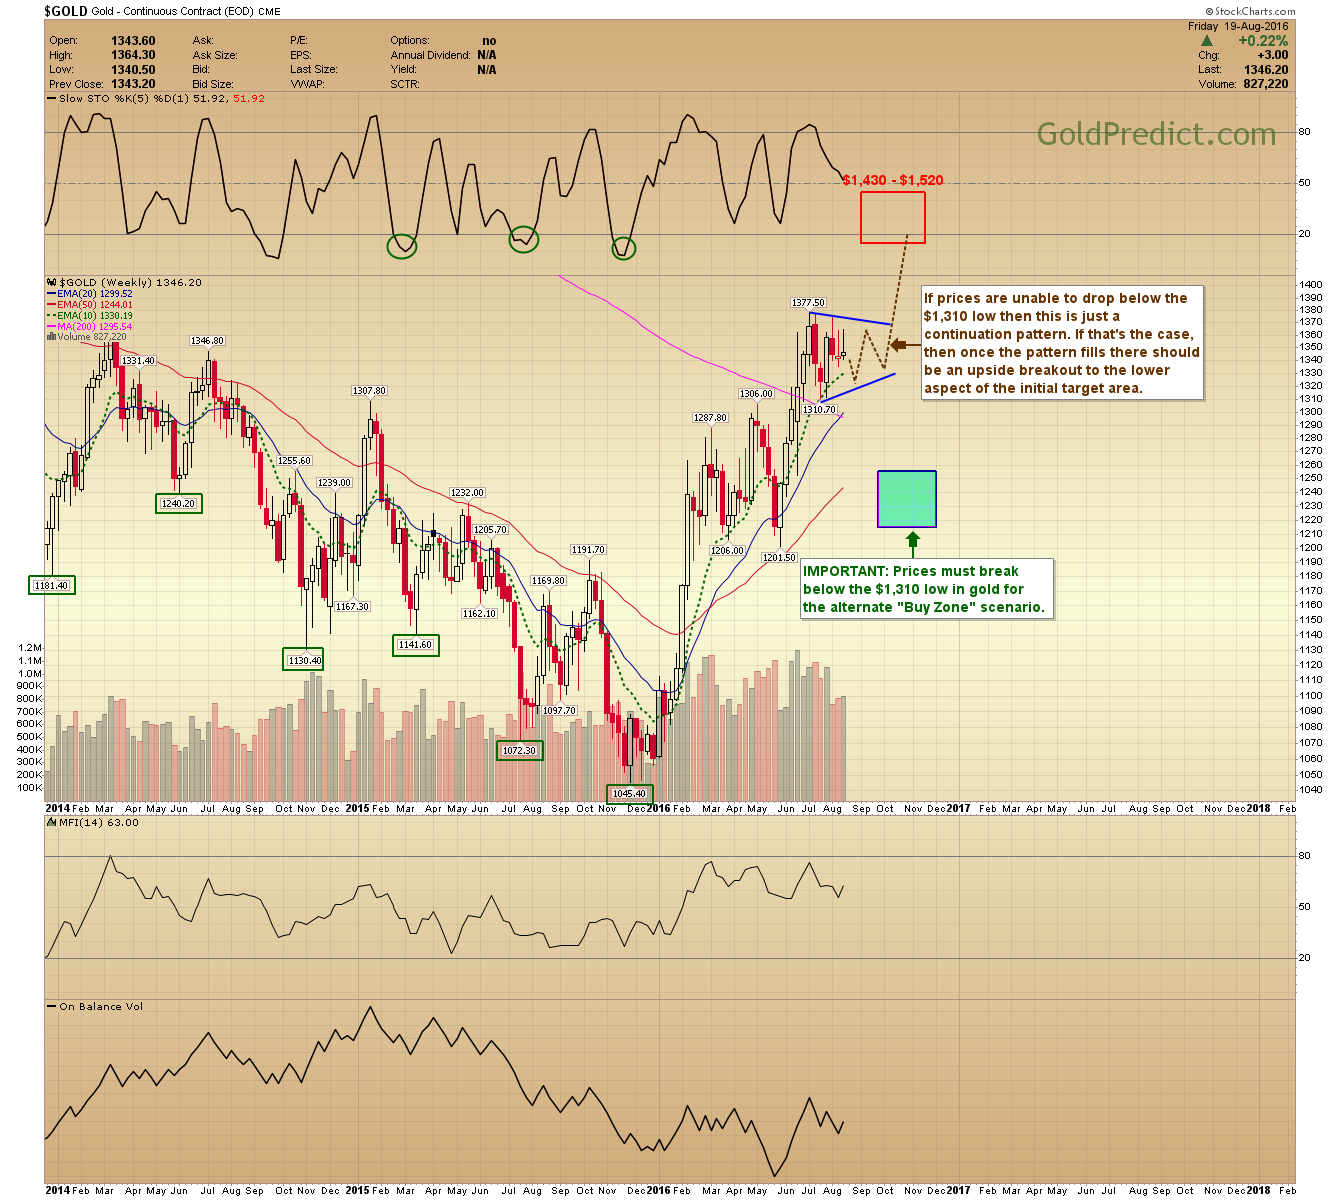
-GOLD- Gold went nowhere the last two weeks while the dollar dropped sharply. A near-term bottom in the dollar and subsequent rally may be the pressure required to get a sustained breakdown into the Buy Zone.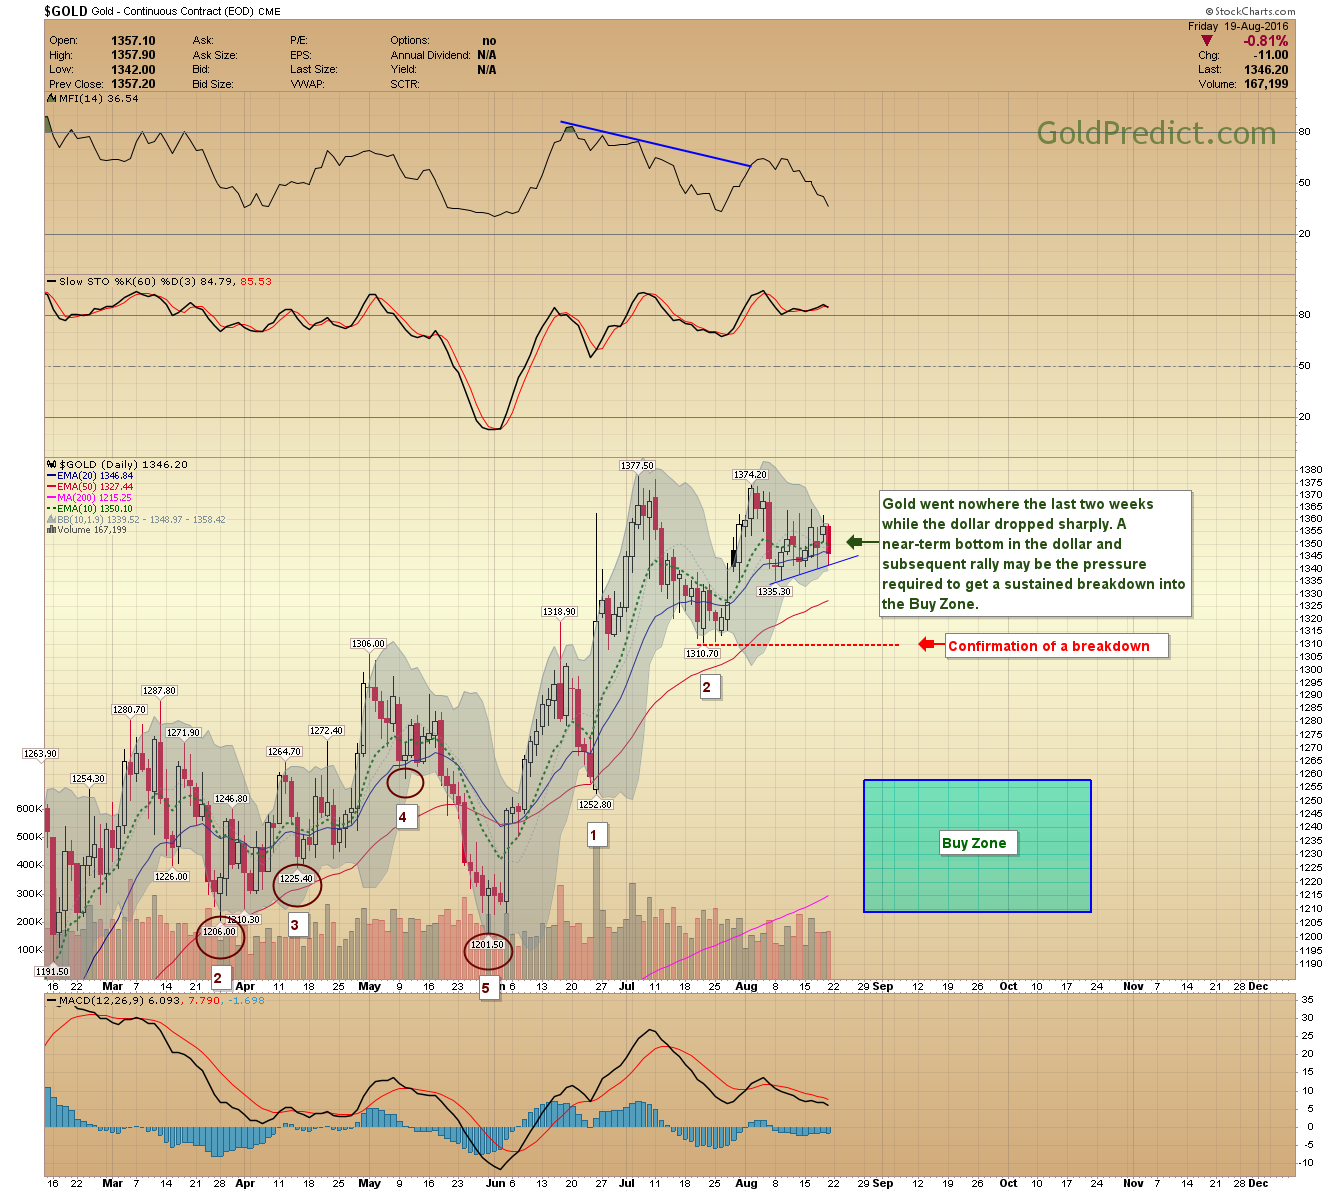
-SILVER- Daily Silver prices are very close to breaking down. If they don't bounce early next week, we could see a sharp break lower. Are silver prices leading the move lower?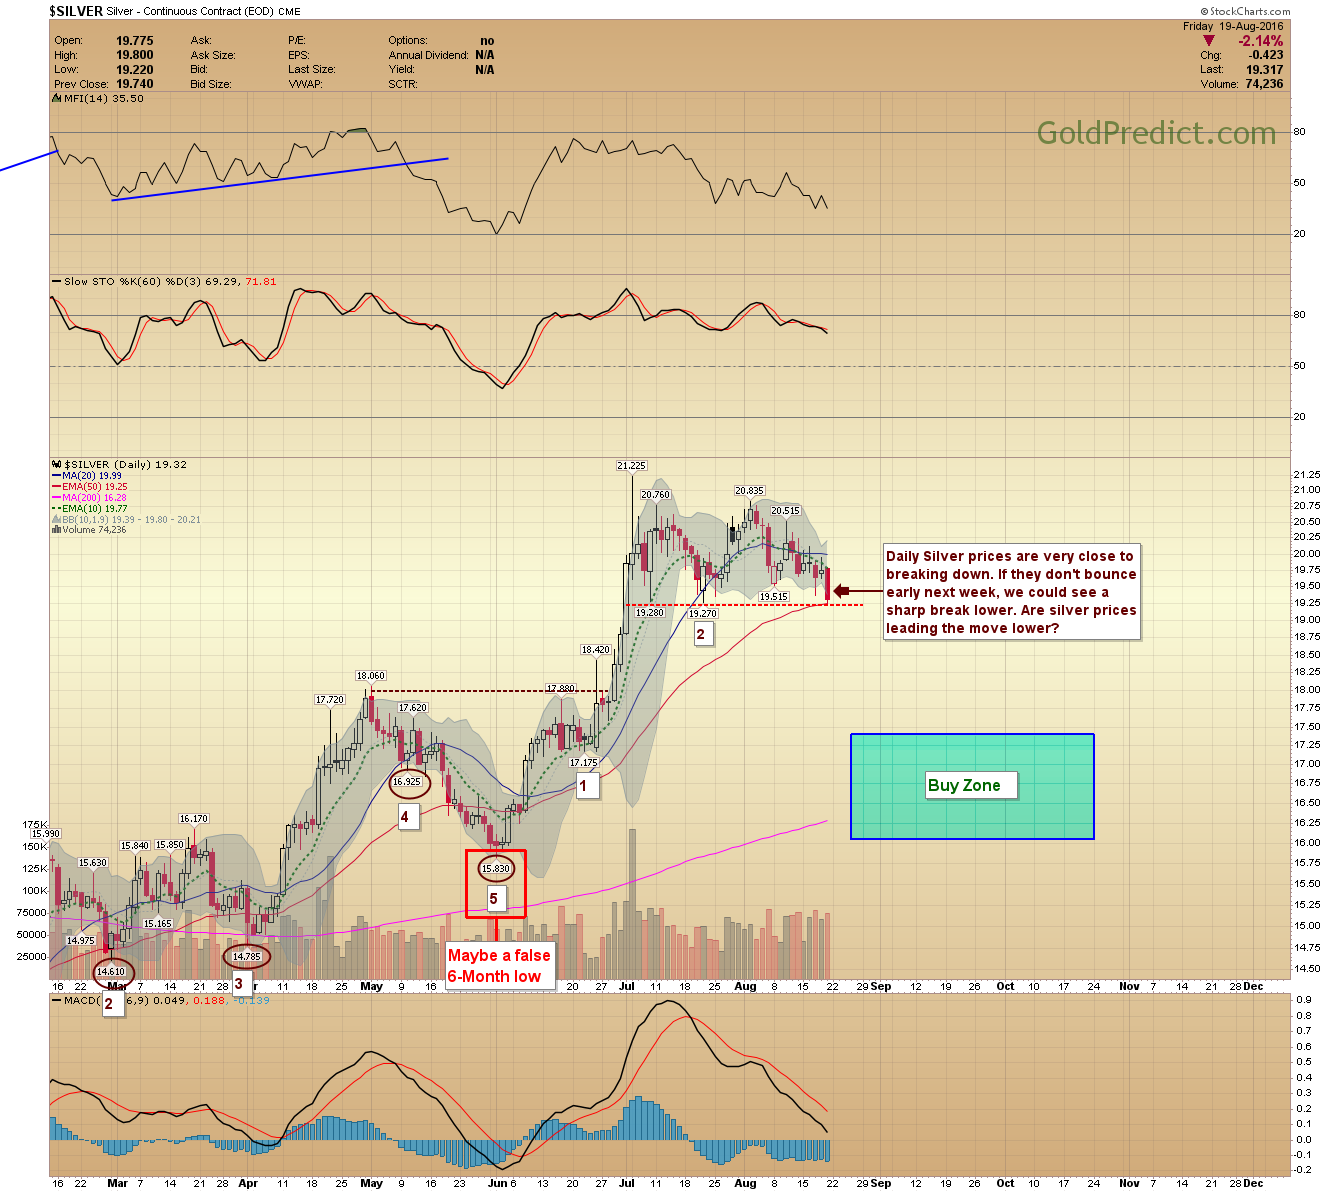
-HUI- The HUI needs lower closes below the 50-day EMA to convince me it is indeed breaking down to the Buy Zone.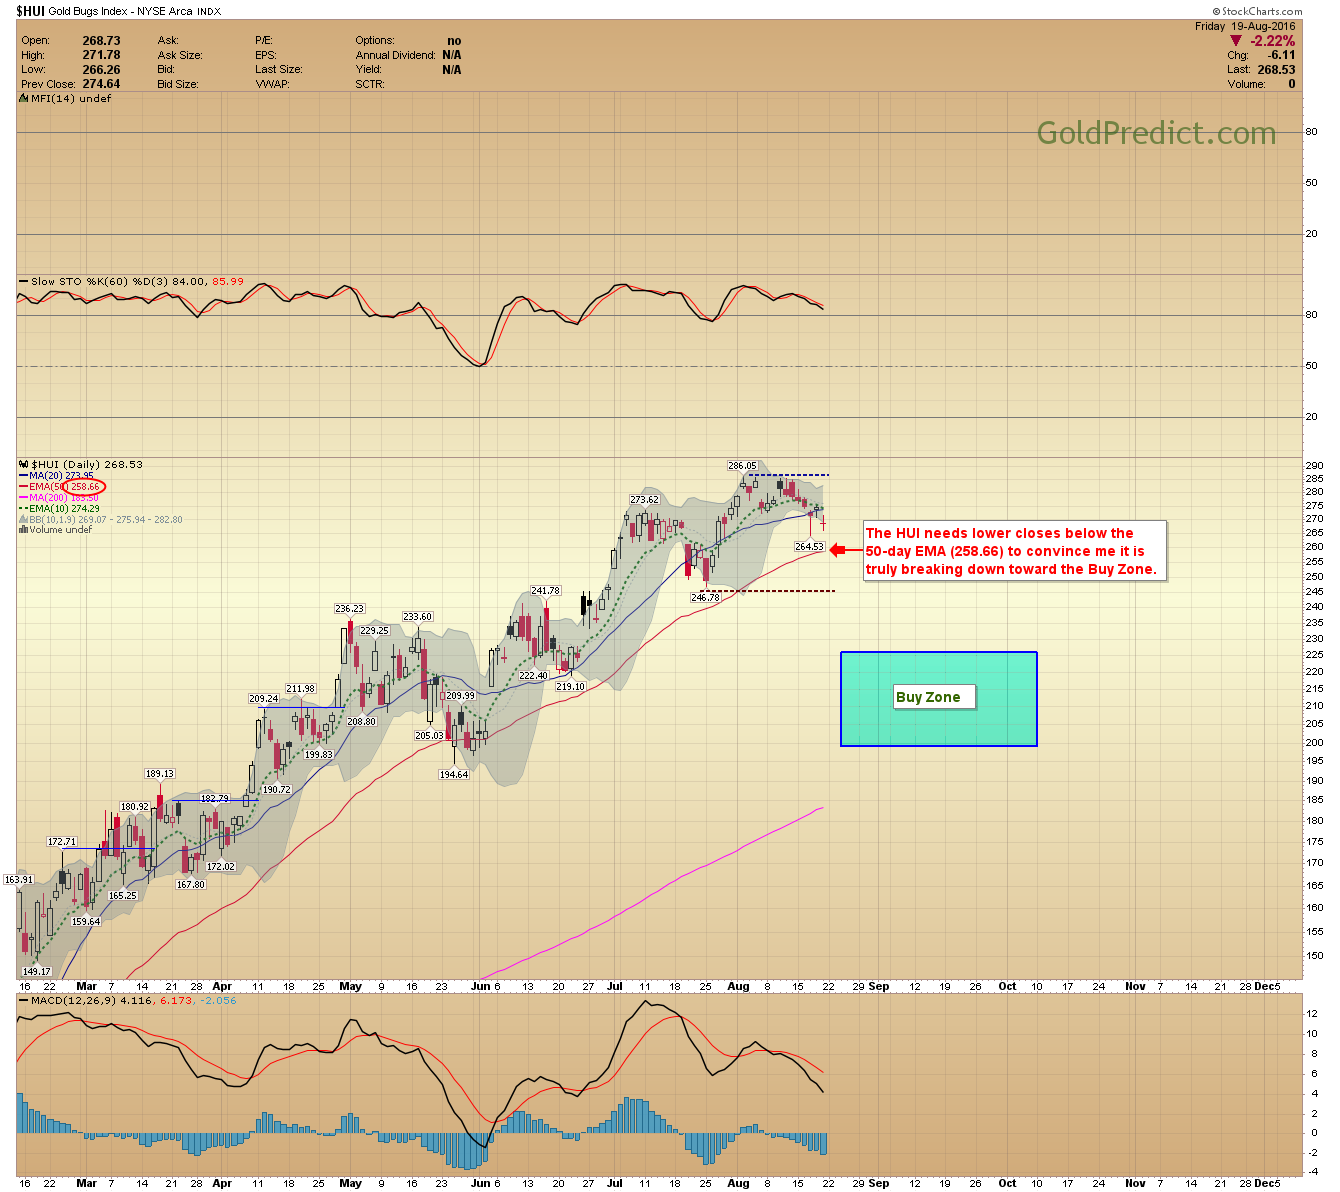
-VanEck Vectors Gold Miners (NYSE:GDX)- Prices closed a few pennies below the lower Bollinger band. This occurring after a compression zone sometimes leads to a breakdown. Nevertheless, I need consecutive lower closes under the 50-day EMA to convince me this is more than just a consolidation period.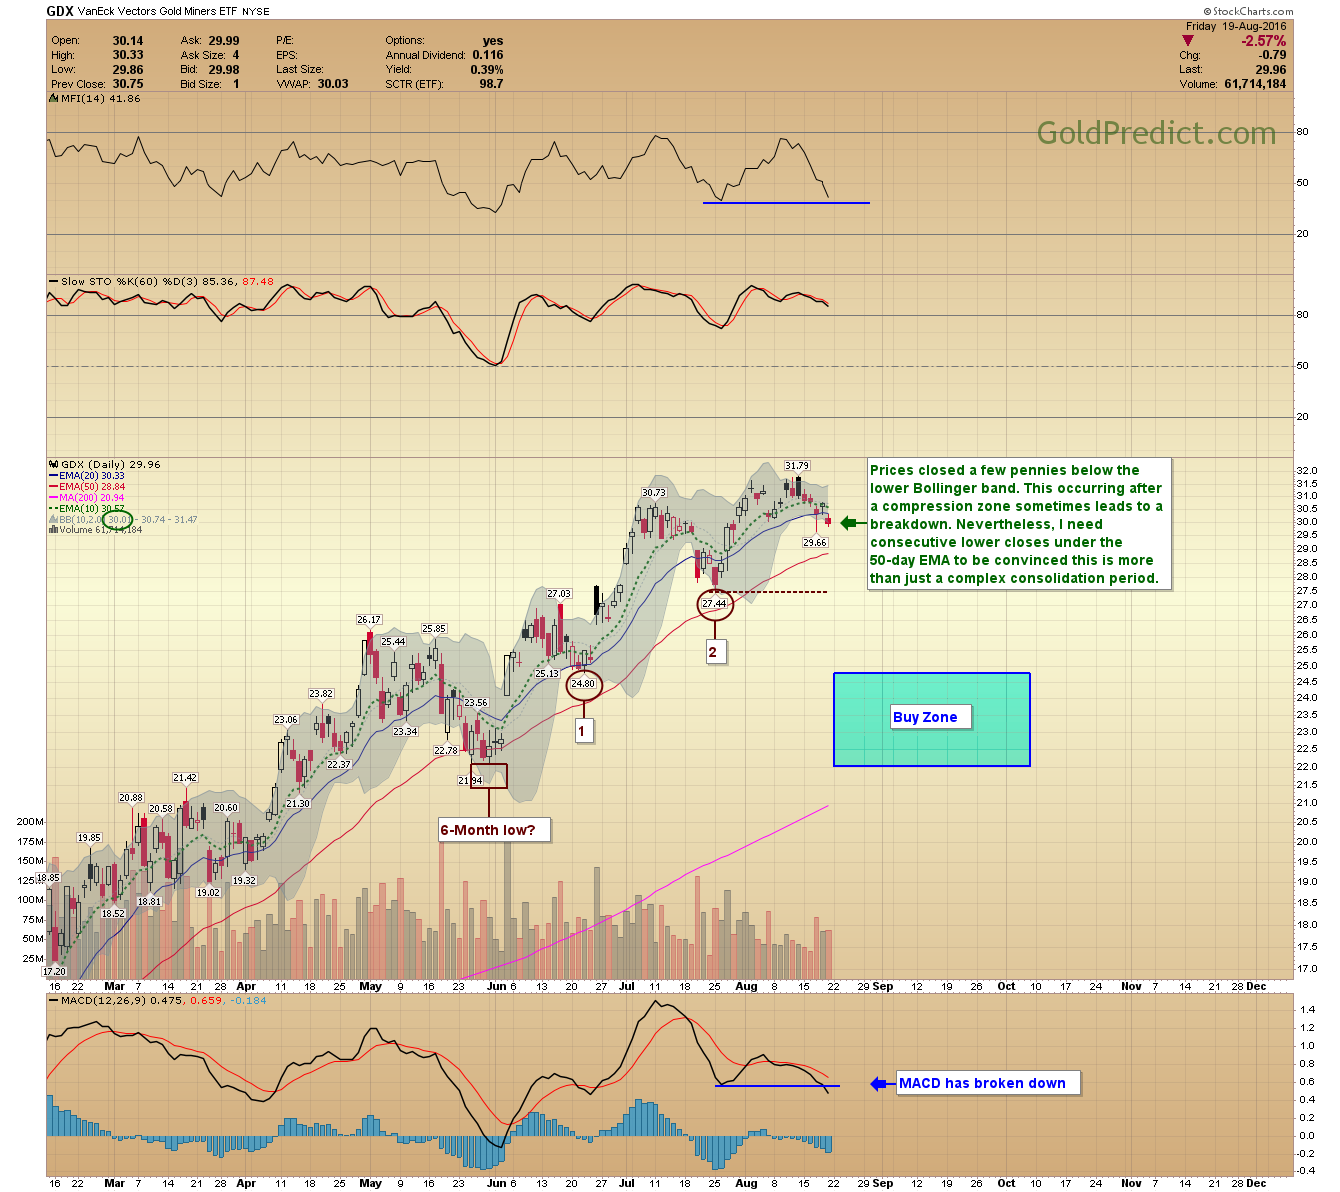
-VanEck Vectors Junior Gold Miners (NYSE:GDXJ)- I can almost make out a miniature head and shoulder pattern. A close below $49.00 should trigger it. The larger model targets around $35.00 if the $43.50 low is broken.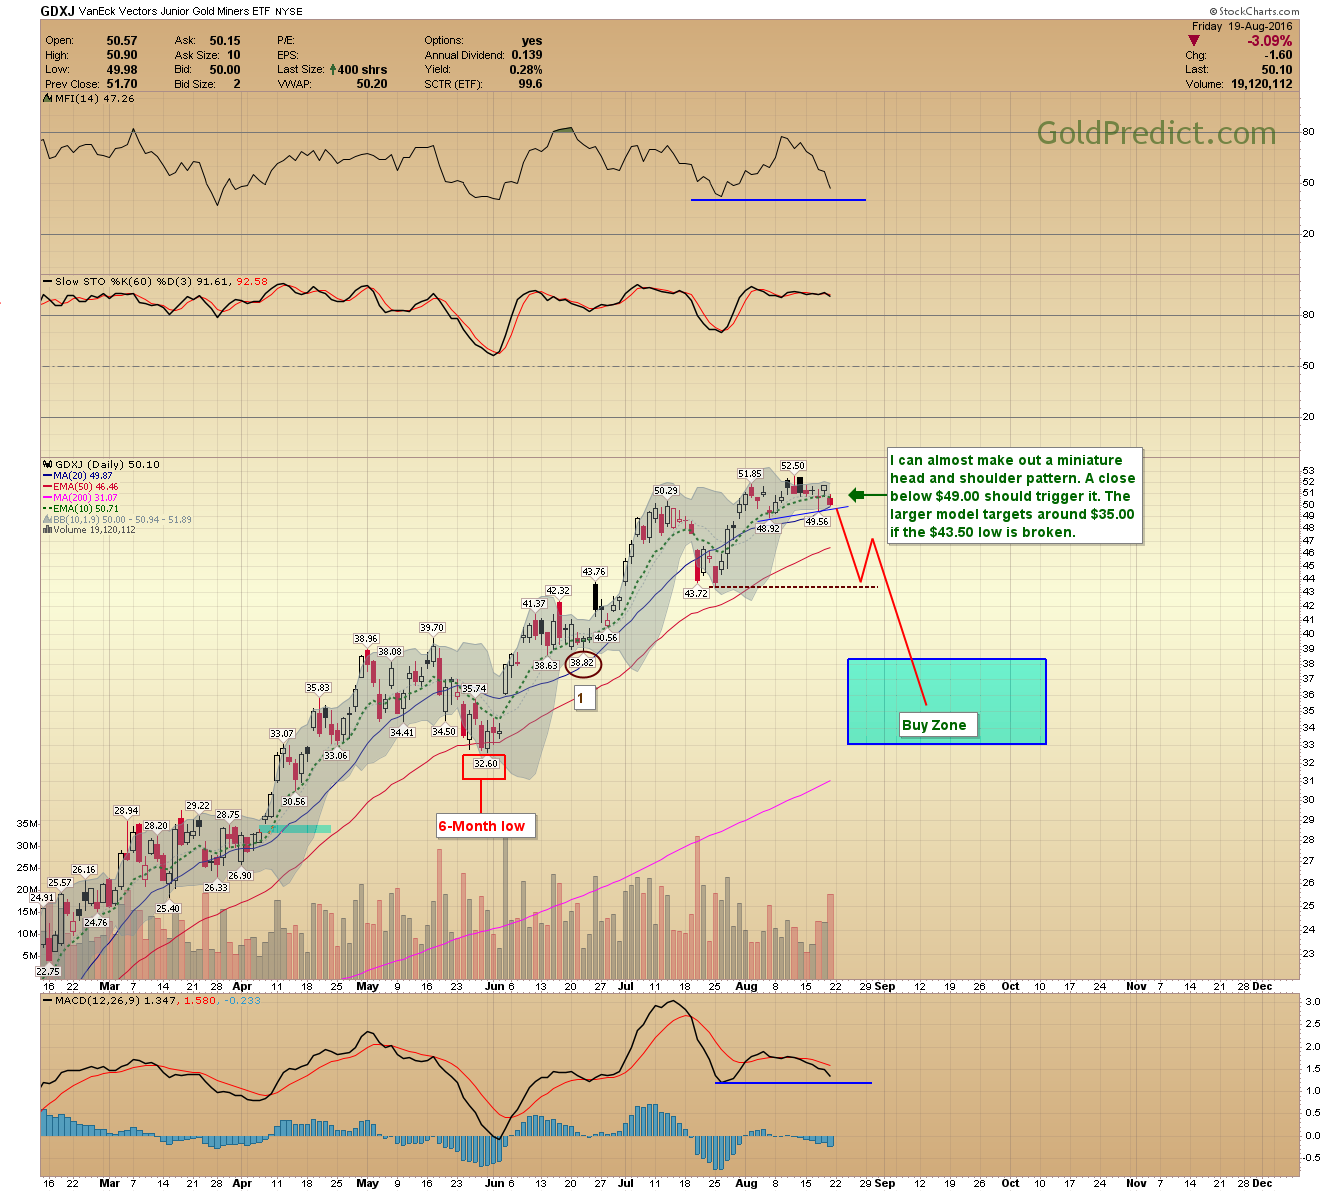
-SPDR S&P 500 (NYSE:SPY)- Still boxed in and nothing to report.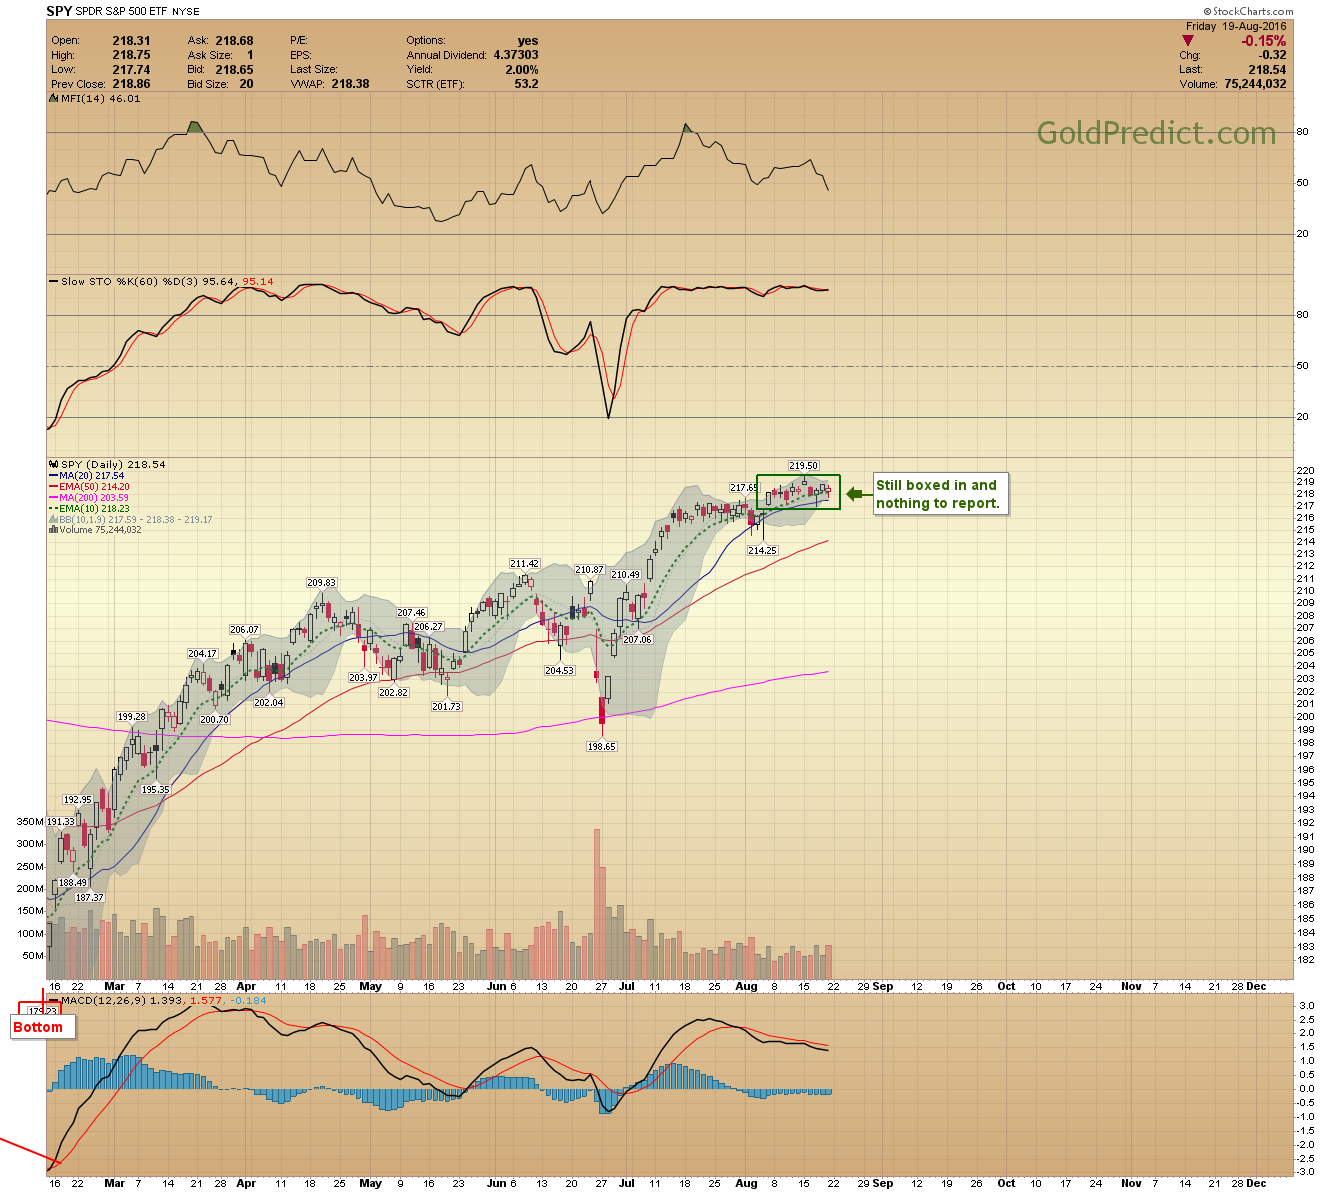
-WTIC WEEKLY- Oil prices rallied 10% this week and are setting up to breakout above the $52.00 resistance. We are heading into the seasonally weak months for oil as the driving season ends. I see both bullish and bearish cases here. I will be watching for consecutively higher weekly closes above $52.00 level for the bulls and the inverse head and shoulder pattern.
Have a great weekend. Expect frequent member updates next week as the structure in metals and the dollar unfolds.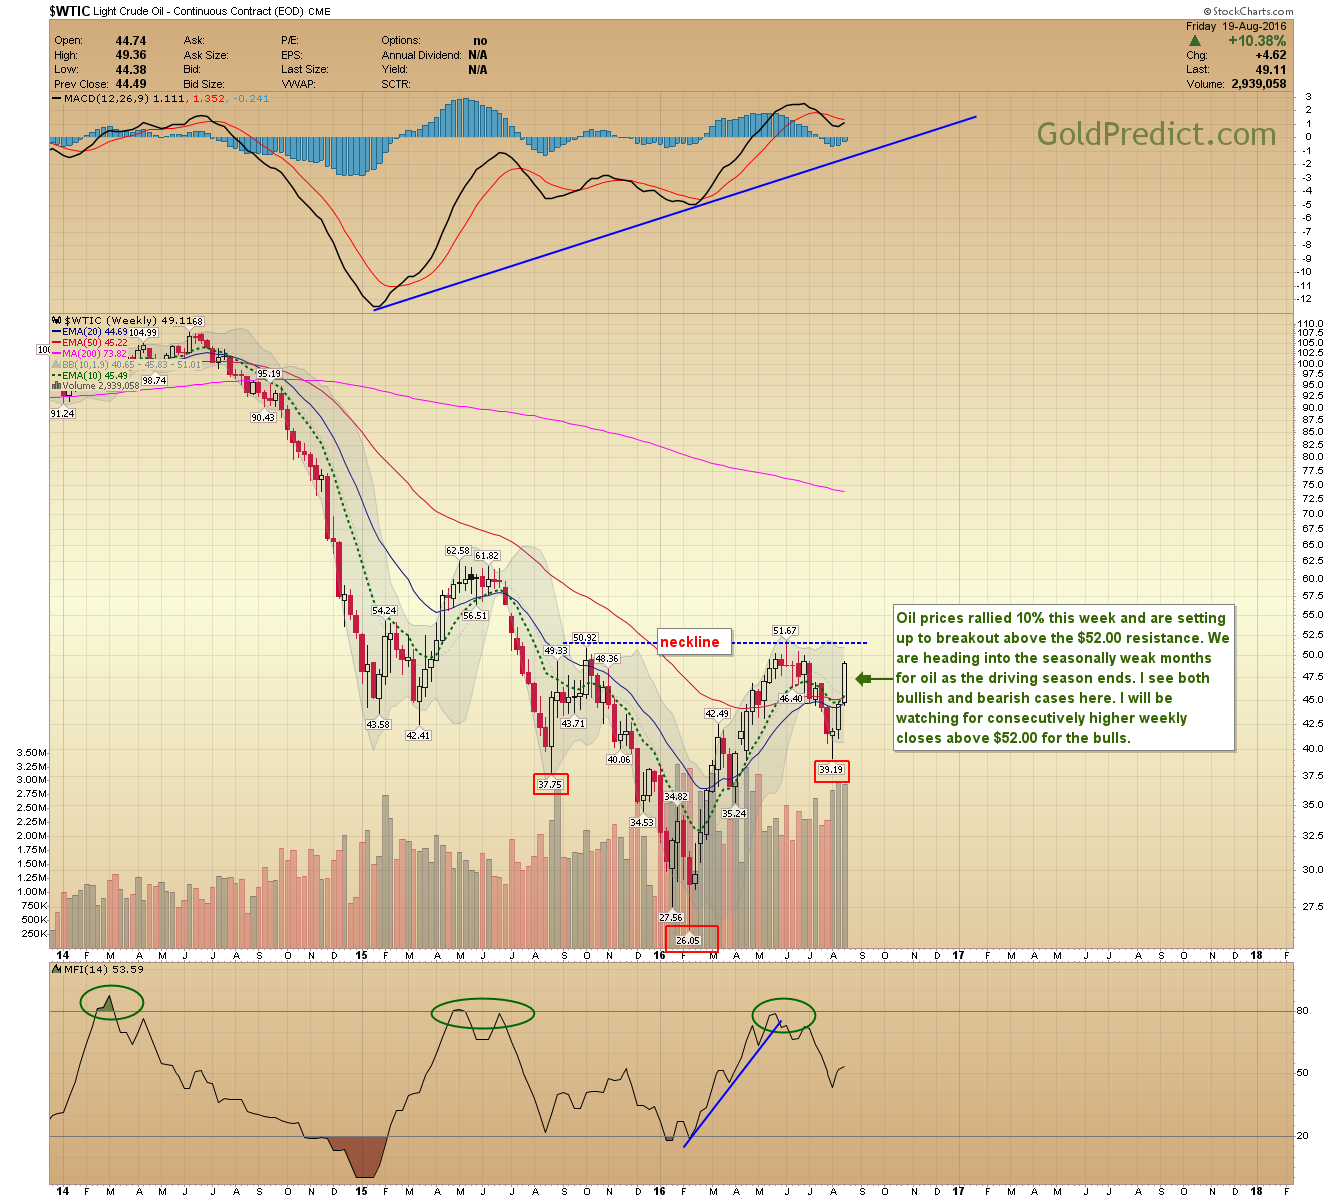
Expect frequent member updates next week as the structure in metals and the dollar unfolds.
