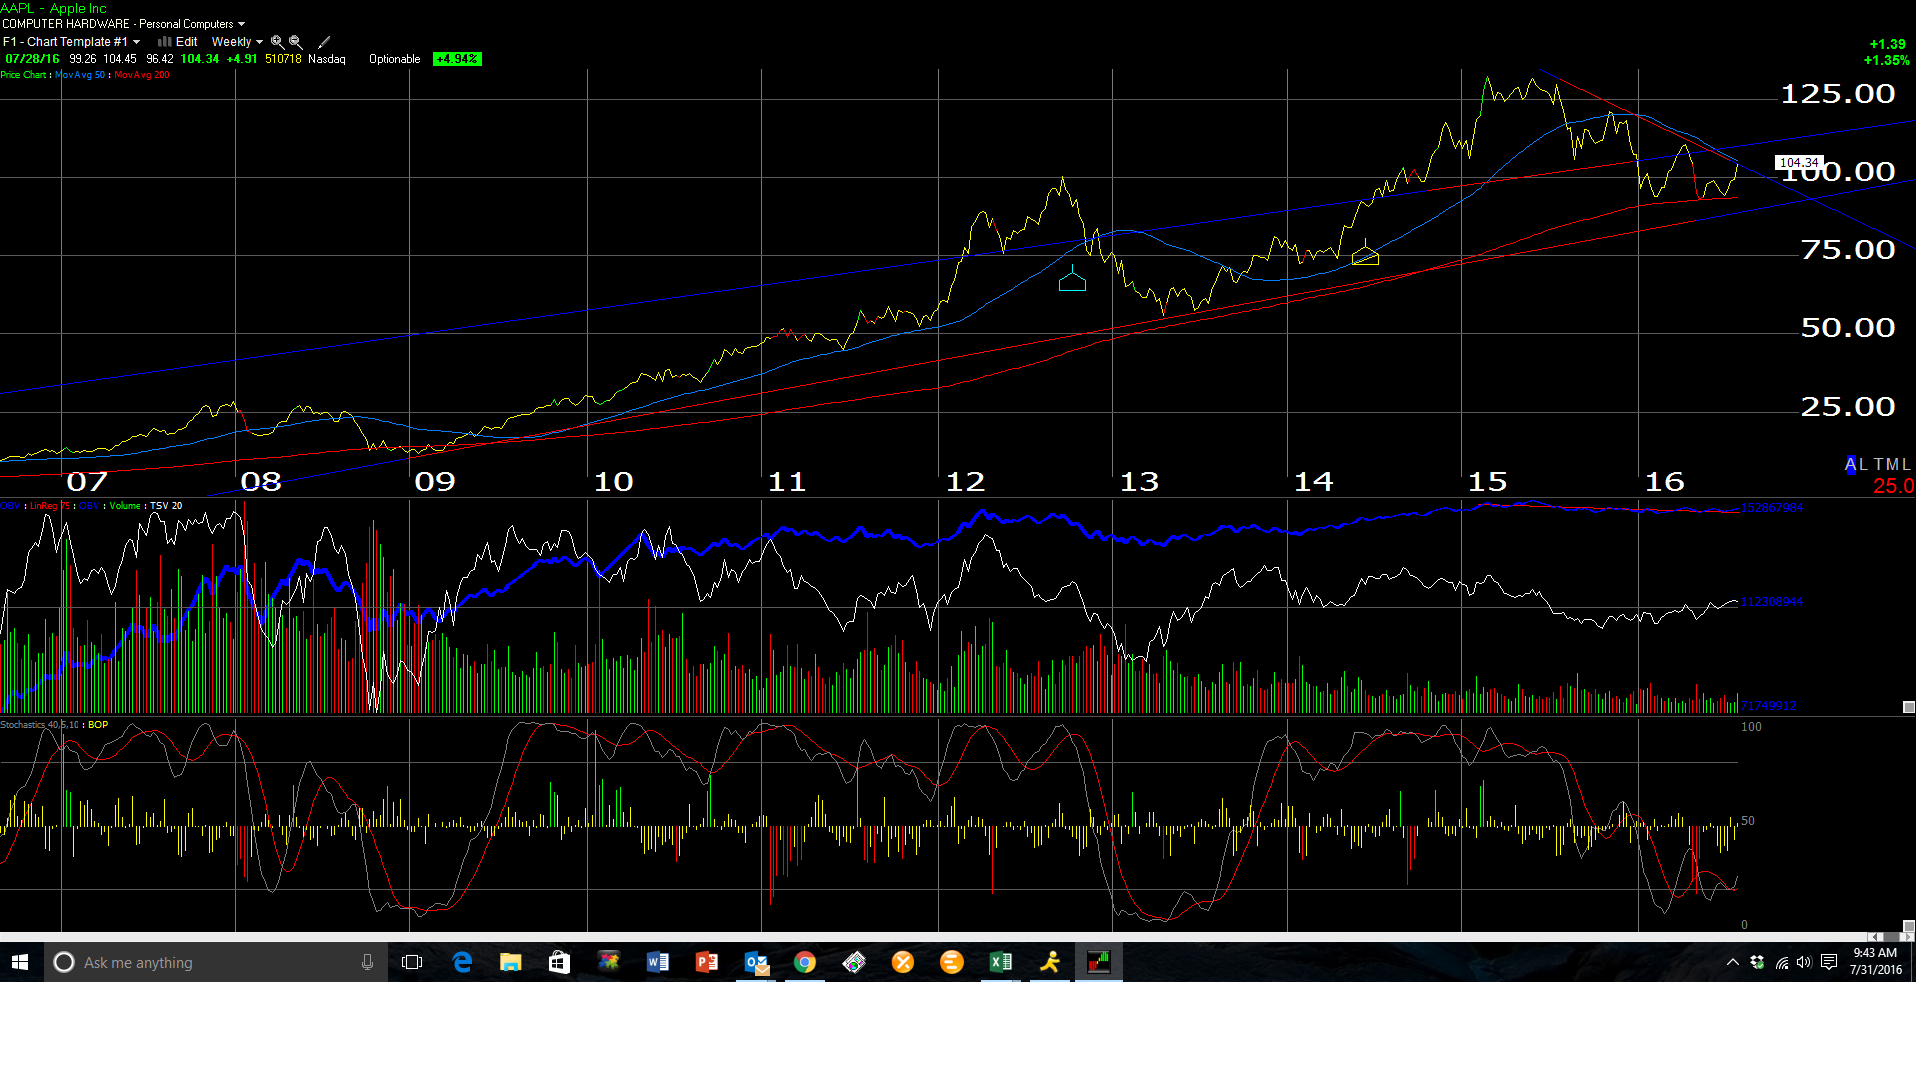
Apple (NASDAQ:AAPL) had a nice bounce after Tuesday’s earnings report, with the stock trading right up to the downtrend line at $104 – $106.
Just to close the loop for readers from last week’s Apple earnings preview and finish the “forward estimate” game, forward estimates are showing a little better growth, but the numbers and how they change tell me that the Street consensus is still a little less convinced about fiscal 2017 (ends 9/30/17) results. See here for the spreadsheet.
However, note the roughly 1% improvement each month in EPS and revenue growth for fiscal 2018. Simply from interpreting the numbers, whatever is in the pipeline for Apple for fiscal 2018 has analysts more excited than the iPhone 7 and what’s in store for fiscal 2017, but much will depend on fiscal 2017 guidance in October 2017.
Technically, a trade above $105 – $106 and AAPL breaks the downtrend line off the $135 highs from the summer of 2015 and likely has more upside (see chart below).
Fundamentally, fiscal 2016 is turning out to be a tough year: Apple’s first year of negative revenue growth in – well – a long time, and more importantly, Apple generated just $4.6 billion in cash-from-operations and just under $1 billion in free-cash-flow in the June ’16 quarter, the lowest cash-flow generation since June, 2009.
I found a glitch in our spreadsheet, where an extra quarter (5 quarters of financial data) was being picked up which distorted the “4-quarter trailing” calculations, but with the correction, even with 4 quarters of data, Apple’s “free-cash-flow yield” is still 9% and price-to-cash-flow and price-to-free-cash-flow “ex-cash” is 6(x) and 8(x) respectively.
Conclusion: Looking at the forward fiscal year estimates and the rolling “forward 4-quarter” EPS estimate for Apple, it looks like Apple’s growth will trough in fiscal Q4 ’16 (Sept ’16 quarter) or fiscal Q1 ’17 (December ’16 quarter).
That being said, the expectations for Apple seem to be for far slower growth going forward, than has been seen historically.
Has Apple become a “growth cyclical” that offers upside only with an iPhone launch, something similar to a Consumer Staple or Consumer Discretionary stock?
I like the stock here for older client accounts that need some defensive characteristics, with upside.
However, readers may wish to wait for the upside above $105 – $106 on good volume, which would tell investors that the recent 15-month downtrend is broken. The stock is banging right up against the downtrend line that began last summer with the highs near $135. Also, the stock has not been this “oversold” since 2013.

After looking for reasons to dislike Apple the last few years, Apple was added to a few accounts last week post-earnings.
Also, as the above link explains, a growing Apple in terms of revenue and EPS estimates is VERY important for S&P 500 earnings as well.
