
ith news over the weekend of a fresh antitrust investigation of Apple's sales tactics by the European Union, we thought we would update some of the Apple charts from our more comprehensive note back in March.
Since removing our bearish bias in April with expectations of a countertrend bounce - the stock has stabilized and now has the potential to rekindle lost momentum with a material change in trend higher. While surprising as that may be, the momentum comparative with oil (circa 2008) that has kept us on the right side of the tracks since last December has pointed to this timeframe as a reversal. In 2009, oil made a long-term low some 32 weeks after its blowoff top. With Apple today, the most recent low was made 30 weeks after the high this past fall.
The chart below now aligns the comparative lows with the respective momentum profiles.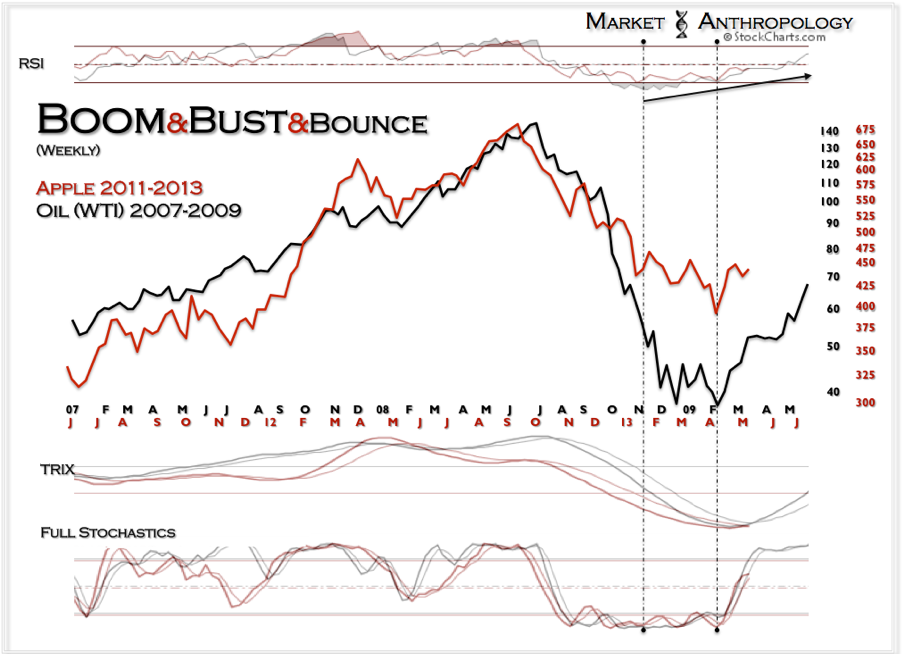
As noted back in March, although not as severe a decline as encountered in oil's breathtaking unwind in 2008, the momentum profile and price structures of the build and breakdowns were quite similar. Namely, the frictionless and scarped declines - painted with positive RSI divergences. If the relative strength divergences sound familiar (see Here) -- it's because the gold miners have walked a similar path.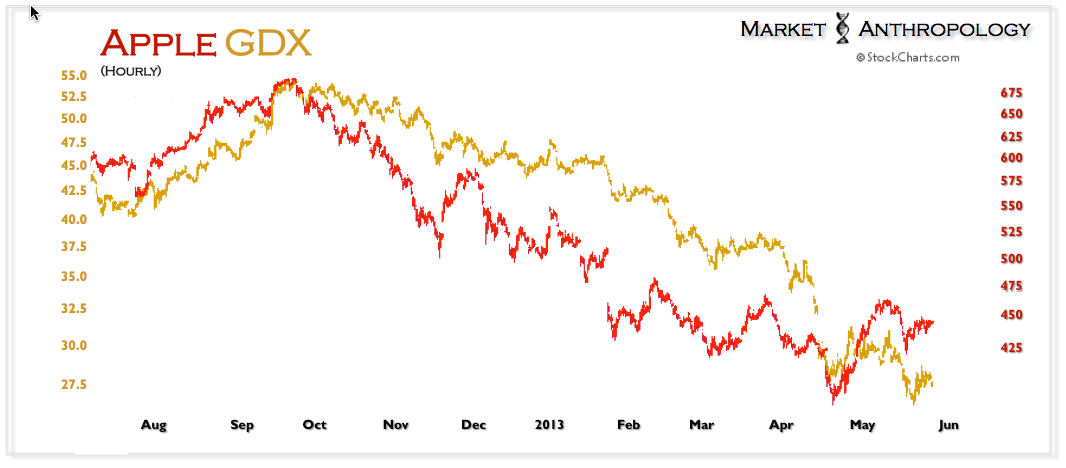
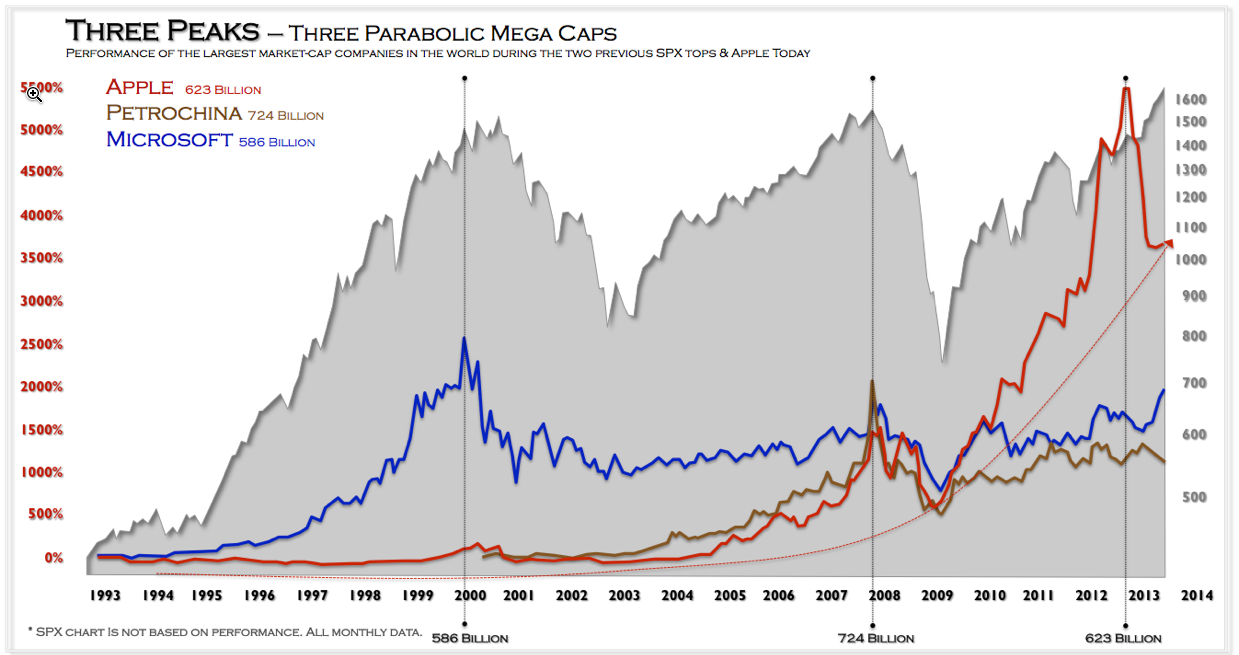
Contrasting the two previous peaks which also culminated with parabolic runs by the largest market cap companies in the world, you will notice that both PetroChina and Microsoft were in similar performance glide paths at this point in time. While the equity markets in 2007 turned down with PetroChina, Microsoft peaked some 36 weeks before the broader market (SPX) finally rolled over. Although it is our expectation that Apple has made the turn higher -- this week marks the 36th week since Apple topped last fall.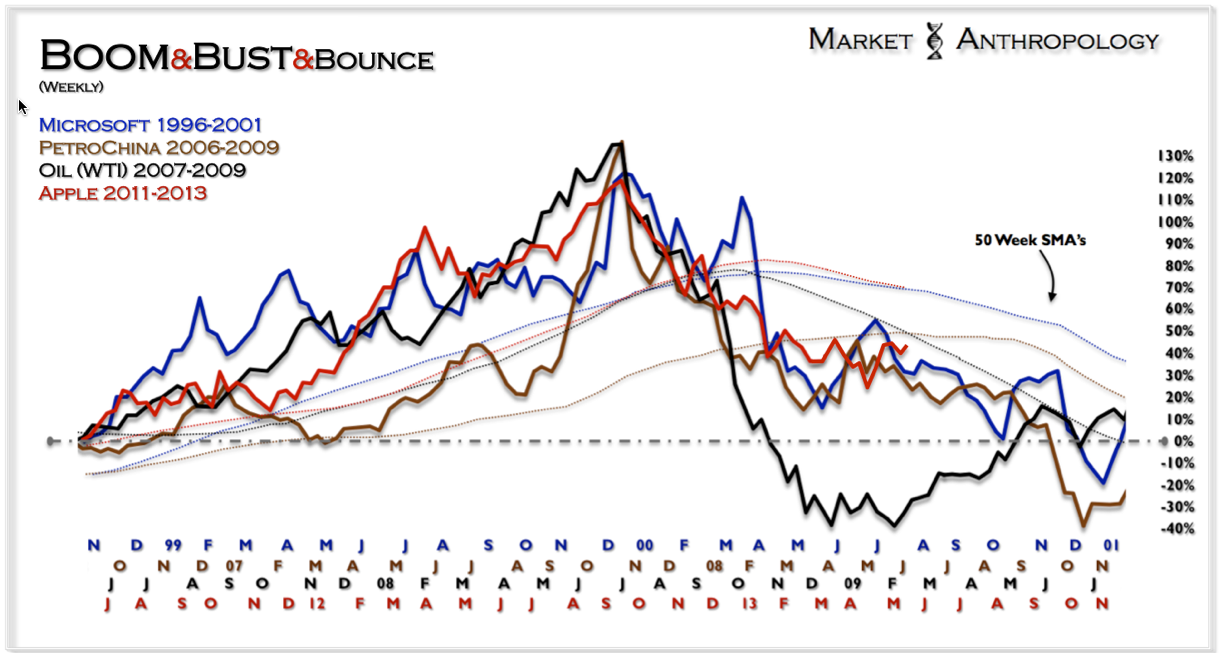
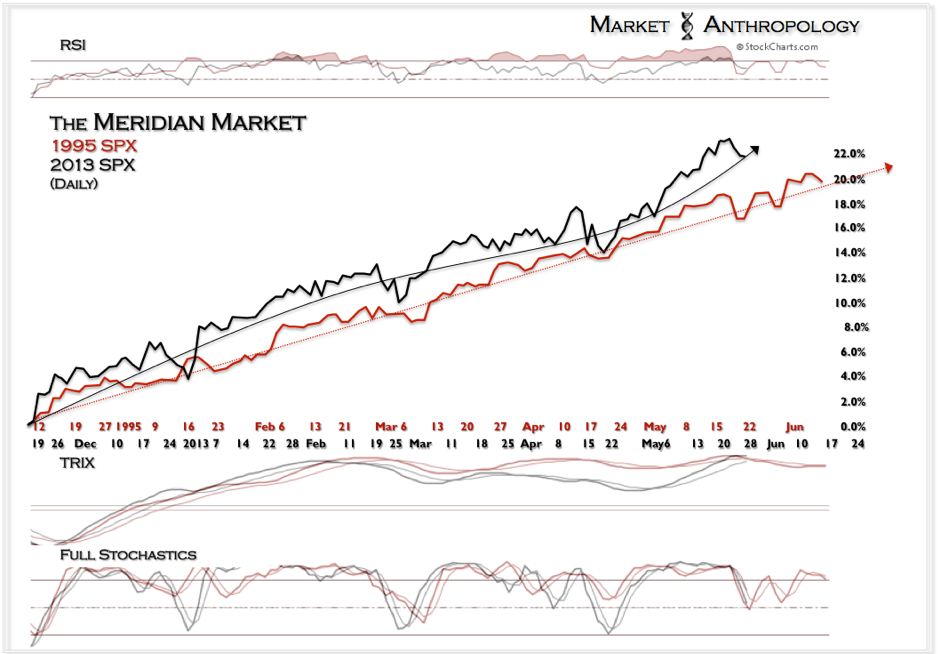
By many fundamental, sentiment and technical extremes, the equity markets should have slowed and corrected their historic ascent weeks ago. But as we have noted and for lack of a better description -- it is what it is. Hindsight is 20/20 as it appears the Meridian's demarkation between rational and irrational trends has lived up to its reputation once again.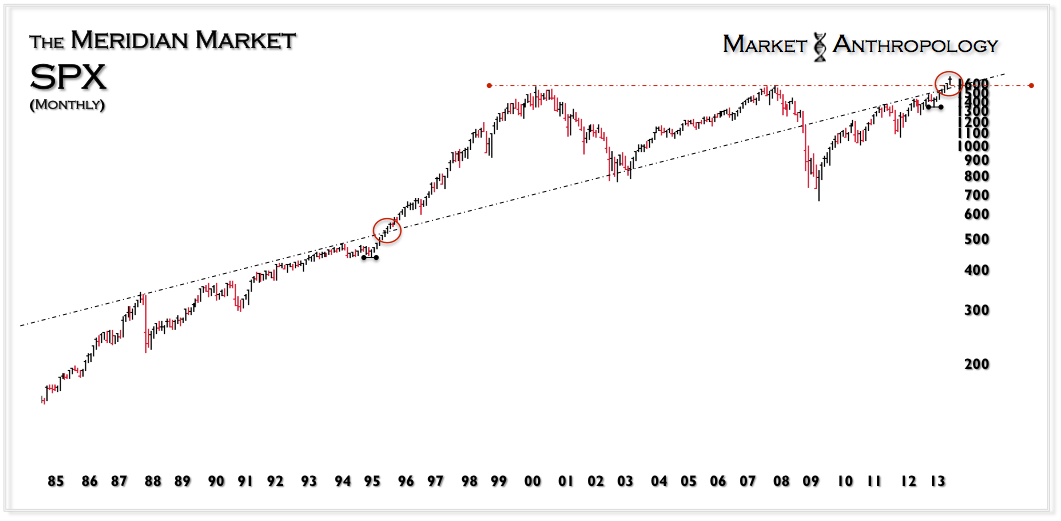
As always, Stay Frosty.
- English (UK)
- English (India)
- English (Canada)
- English (Australia)
- English (South Africa)
- English (Philippines)
- English (Nigeria)
- Deutsch
- Español (España)
- Español (México)
- Français
- Italiano
- Nederlands
- Português (Portugal)
- Polski
- Português (Brasil)
- Русский
- Türkçe
- العربية
- Ελληνικά
- Svenska
- Suomi
- עברית
- 日本語
- 한국어
- 简体中文
- 繁體中文
- Bahasa Indonesia
- Bahasa Melayu
- ไทย
- Tiếng Việt
- हिंदी
Apple Reboots
W
3rd party Ad. Not an offer or recommendation by Investing.com. See disclosure here or
remove ads
.
Latest comments
Install Our App
Risk Disclosure: Trading in financial instruments and/or cryptocurrencies involves high risks including the risk of losing some, or all, of your investment amount, and may not be suitable for all investors. Prices of cryptocurrencies are extremely volatile and may be affected by external factors such as financial, regulatory or political events. Trading on margin increases the financial risks.
Before deciding to trade in financial instrument or cryptocurrencies you should be fully informed of the risks and costs associated with trading the financial markets, carefully consider your investment objectives, level of experience, and risk appetite, and seek professional advice where needed.
Fusion Media would like to remind you that the data contained in this website is not necessarily real-time nor accurate. The data and prices on the website are not necessarily provided by any market or exchange, but may be provided by market makers, and so prices may not be accurate and may differ from the actual price at any given market, meaning prices are indicative and not appropriate for trading purposes. Fusion Media and any provider of the data contained in this website will not accept liability for any loss or damage as a result of your trading, or your reliance on the information contained within this website.
It is prohibited to use, store, reproduce, display, modify, transmit or distribute the data contained in this website without the explicit prior written permission of Fusion Media and/or the data provider. All intellectual property rights are reserved by the providers and/or the exchange providing the data contained in this website.
Fusion Media may be compensated by the advertisers that appear on the website, based on your interaction with the advertisements or advertisers.
© 2007-2024 - Fusion Media Limited. All Rights Reserved.