
Apple (NASDAQ:AAPL) was stuck in a trading range for the past five months. For much of that trading range, AAPL neatly pivoted around its 50-day moving average (DMA). I noticed these combined behaviors starting around early May. I have written about them and traded them.
Today, July 9th, AAPL finally dropped out of the trading range and in the process flipped to oversold. Conveniently, this has happened just as the stock is making a rare (re)test of support at its 200DMA.
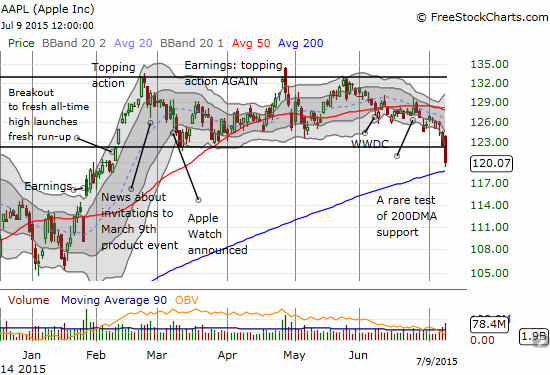
Apple (AAPL) breaks down and trades below the recent trading range AND well below its lower-Bollinger Band (BB)
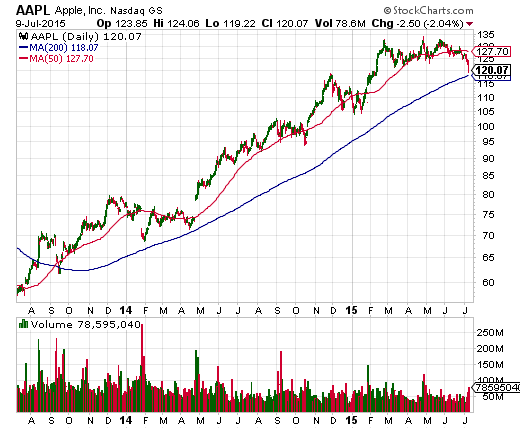
Apple has not tested its 200DMA in 14 months. AAPL has not crossed this critical line of support since September, 2013
I use two charts because FreeStockCharts cannot draw the 200DMA far enough to show the last tests of this critical line of support (technical issues).
There are several critical features to note in the daily chart:
- Unlike previous topping patterns, this year’s topping patterns turned out to indeed flag imminent weakness.
- The three days of selling that confirmed the breakdown below the 50DMA in late June, also confirmed the topping patterns (as a short-term signal).
- The black horizontal lines represent an approximate trading range drawn at upside and downside closes. This trading range finally failed on Thursday, July 9, 2015.
- AAPL closed below its lower-Bollinger Band (BB) for the second day in a row and third day out of the last eight trading days. This is rare selling pressure for AAPL and today’s acceleration of that selling marks a technical oversold condition. This observation suggests that the odds have greatly increased that sellers have exhausted themselves (washed out) and that buyers will send the stock snapping upwards. The Bollinger Band represents the number of standard deviations of distance from the 20DMA. The lower-BB is drawn at 2 standard deviations BELOW the 20DMA.
- AAPL now hovers just above its 200DMA. This is a very critical, long-term line of support that AAPL cleared twice last year. I consider this test a confirmation of the high odds of a quick snap upward for AAPL.
Accordingly, almost by reflex, I bought AAPL call options near today’s close (expiration next week). The upside target is first a reversal of today’s losses. Such a test would take AAPL back to the top of the current downward trend channel. The top part is formed by the lower band of the first Bollinger Band, one standard deviation away from the 20DMA. Under ideal conditions, the 20DMA, or even the 50DMA, is the ultimate (short-term) target for a bounce.
All things considered, AAPL has survived the current market sell-off relatively well. The stock is still up 8.8% for the year. Before this week, AAPL was holding close to its 50DMA pivot and kept its trading range intact. Given the amount of promise AAPL has shown in China, the current panic about China’s economy SHOULD have hit AAPL’s stock a lot harder, a lot sooner. This apparent delayed response is yet one more indicator that suggests to me that sellers are finally at the point of exhaustion. That is, they tried and tried to hold onto their best stocks, like AAPL, but finally rushed for the exits all at once. AAPL lost 2.0% on this day – a rare one-day drop for the stock on a day when the NASDAQ (QQQ) GAINED fractionally (granted, the index faded hard throughout the day).
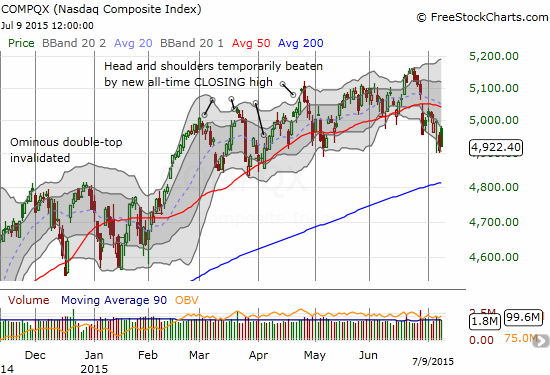
The NASDAQ is also breaking down, but today it managed to close in the green despite a vicious fade from the day’s high
Coincidentally, the Shanghai Composite Index (SSEC) demonstrated the power of a test of 200DMA support on the same trading day (but before AAPL’s sell-off given the difference in time zones). The Chinese government must be reading its charts in its increasingly desperate efforts to keep the bubble propped up.
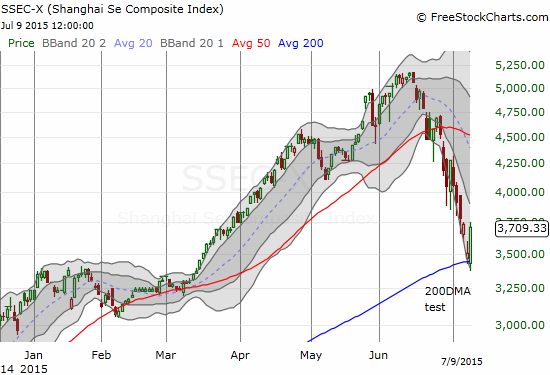
The Shanghai Composite Index (SSEC) soars 5.8% on a successful test of 200DMA support
While this bounce did not help AAPL one bit on Thursday, let’s see whether a buying response is just as delayed as the selling response for AAPL.
Be careful out there!
Full disclosure: long AAPL call options