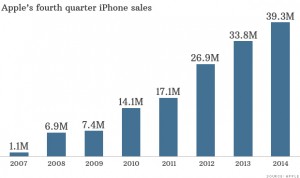
$41 billion worth of apples a quarter keeps the bears away or something like that. Apple Inc (NASDAQ:AAPL) reported earnings on Monday and beat estimates by a fair amount. Not surprising iPhone sales were brisk coming in at 39.3 million for the 3rd quarter. Why this came as a major surprise to analysts is the question when the company reported record sales of the new iPhone 6 and iPhone 6 Plus within the first few days after its release. What may have come, as a surprise though was the uptick in Mac sales, climbing 21% over the same quarter in 2013. Apple again has the largest piece of the PC markets since 1995. Check out the graph from Apple for quarterly iPhone sales:

On the disappointing side were iPad sales, which continue to slump – down 13% from last year, which makes three straight quarters of shrinking sales for Apple’s tablet. All in all though, Apple sales continue to impress rising 12.4% to $42.1 billion and leaving the street’s estimates in the dust by $2.2 billion. That’s a lot of apples.
Back at the ranch
I continue to find it fascinating how traders and investors are so willing to buy the past as a guarantee of future performance. Of course CEO’s and CFO’s bring much of this on by providing “forward guidance” during conference calls after announcing earnings, which I suppose brings about a stronger discussion on asymmetrical information.
The broader indexes initially were caught between a rock and a hard place so to speak. The DJIA fell prey to disappointing earnings from IBM sending the index down over 150 points initially. The NASDAQ struggled to sell off and the sellers finally gave in as the DJIA began to see the light as the balance of the index opened stronger. The SPX quickly fell in line with the DJIA but similar to the NDX didn’t find stronger support to sell and switched gears shortly before the U.S. open and finishing up over 1% by the close. The DJIA took most of the session but did manage to push into the green by the close and adding an additional 30 points after AAPL reported.
The larger corrections are likely still in force with the markets putting the finishing moves on what is likely best viewed as an intervening rally or ‘bounce’. Here are the numbers thus far:
The DJIA, (basis the YM) appears to have completed a 3-wave advance off of last week’s 15769 low reaching 16418 early in Sunday’s globex session, which was midway between Fibonacci resistance at 16346 (38%) and 16524 (50%). Monday’s low at 16163 keeps the potential alive for a finishing rally with a new high above 16418 in sight. Resistance at 16524 is likely to contain the move. A break below 16125 though would negate the potential for additional upside and signal a resumption of the next let down of the larger correction. The DJIA should continue to find support at 15673 and then 15276.
The SPX, (basis the ES) broke back above the 1900 level after AAPL reported on Monday and stopped short of resistance (Fibonacci 50%) at 1914. Like the YM, the ES has traced out a clean 3-wave advance off of last week’s 1813 low. The ES continues to carry potential for the market to rally to an additional high but resistance at 1914 is likely to contain any follow through buying. A clean break above 1914 pushes resistance to 1937.50, (62% Fibonacci retracement level). The ES would need to break back below 1870 to negate upside potential for now and signal the next leg down is underway.
The NQ received the largest benefit from APPL’s earnings and carries stronger potential for additional upside as a buyers push up the price of Apple. The market thus far appears to have completed or nearly so a 3-wave advance off of last week’s 3684 low. Resistance remains at 3901 and while expectations would be for that level to contain any follow through buying a break above with follow though raises resistance to the 3950 area. A break back below 3840 to 3835 though, will likely negate upside potential for now and renew the probability of the next leg down being underway.
Remember the key is being able to reduce and separate the “noise” from opportunity. This takes knowing and executing a well-defined strategy and allows you to see opportunities amongst the “chaos” and by trusting the mechanics of your strategy, be able to take advantage of them.
Opportunity continues to knock on our doors. While it doesn’t come without risk, risk can be defined and more manageable. Volatility and broad moves are exactly what a day trader desires and being able to respond without questioning is a luxury many are unaware of.
Steer the course and don’t compare yourself to everyone else. You are not they and they are not you. Remember to trust and believe what makes you unique at this moment in time and in this situation and allow others to choose for themselves. Don’t be swallowed up by the chaos and false emotions swirling around. Remember it’s just a number.
