Apple (NASDAQ:AAPL) missed on earnings and dropped 6.26% yesterday to close at $97.82. It was (and still is) a universally loved stock. Last 2 analyst ratings before the earnings report had put a price target of $150. Almost everyone had a buy rating on it. And yet it is down 24% over 12 months. Analysts have now all rushed to reduce price targets (remaining bullish though), which usually makes us consider taking the other side. Short signal flashed on April 15th and is signaling a cover soon as the stock is oversold and has reacted positively yesterday on the large gap down open.
Long Term View
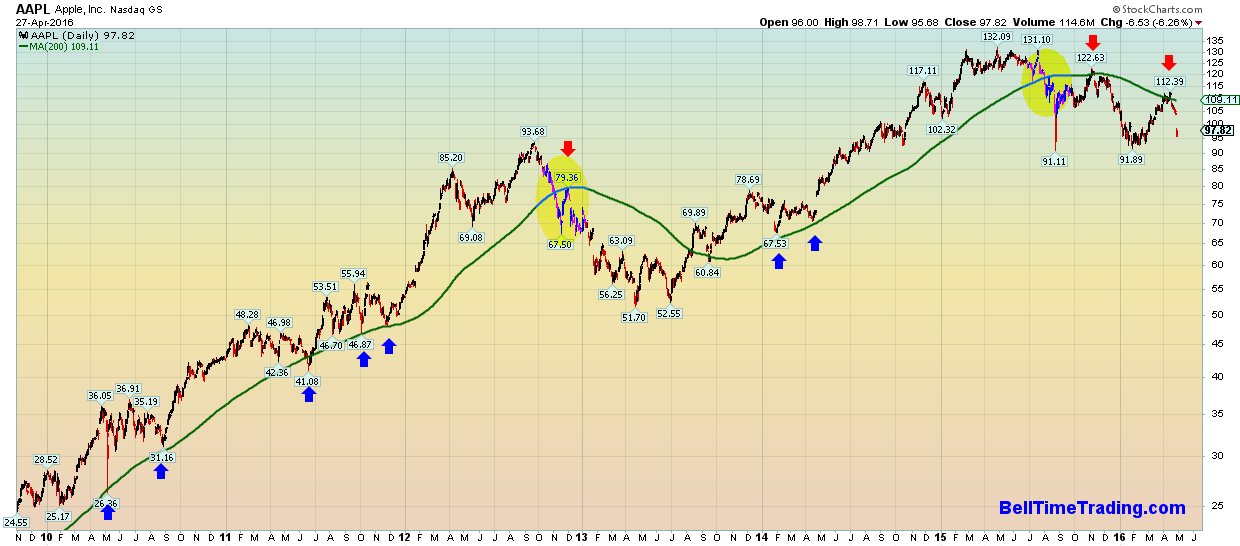
Notice the long term relationship the stock has with its respective 200-day simple moving average (the green line). Holding the stock during the 2010-2012 period while adding at the green line (blue arrows) and trimming down as it got away was a very profitable strategy. Once it broke the 200-day, which flattened out and retested it from underneath (yellow area in late 2012), it was a change in regime which suggested shorting at the green line. Only 1 signal was produced (red arrow) but worked very well.
Another bullish regime started once the stock broke above the green line that started to ascend again in 2014. The similarity in cycles became obvious late last year when stock broke back below the 200-day SMA and a short signal flashed it as it bounced up to green line (red arrow late 2015). Another very precise sell short signal occurred on April 15th.
The Short Entry
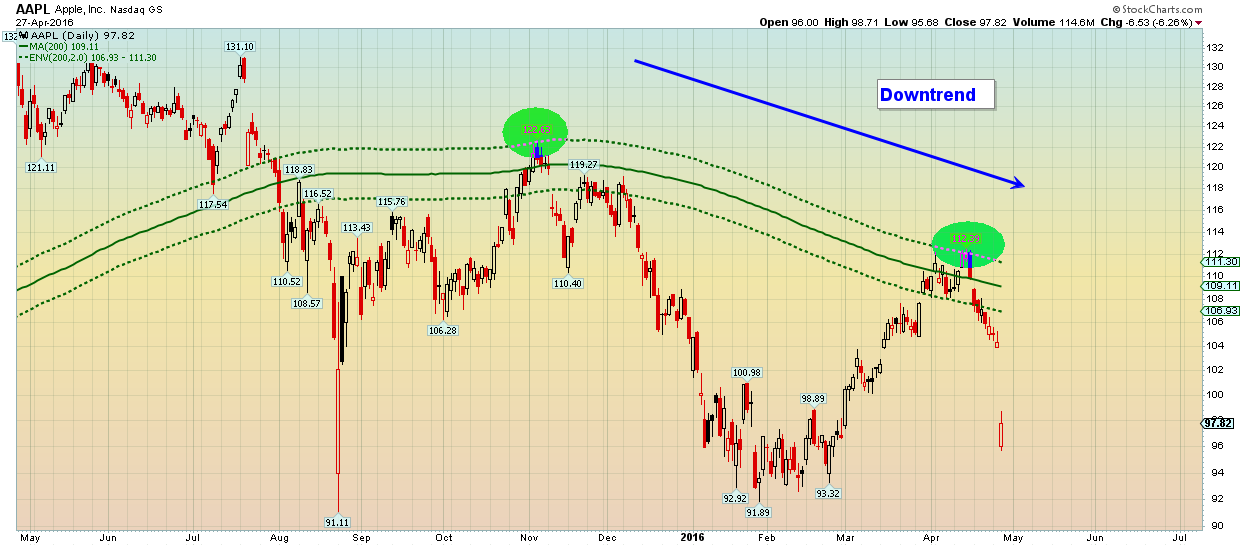
Here is the 1-year daily chart showing the 200-day SMA (green line). In November 2015 Apple topped 2% above the 200-day SMA. On April 13th and 14th the stock topped at the exact same spot. Exactly 2% above the green line (shown as a dashed line), which is now in a clear downtrend, and our regime for AAPL is to sell rips. A strong selloff on April 15 flashed the sell short signal, with a stop right above April 13th-14th top.
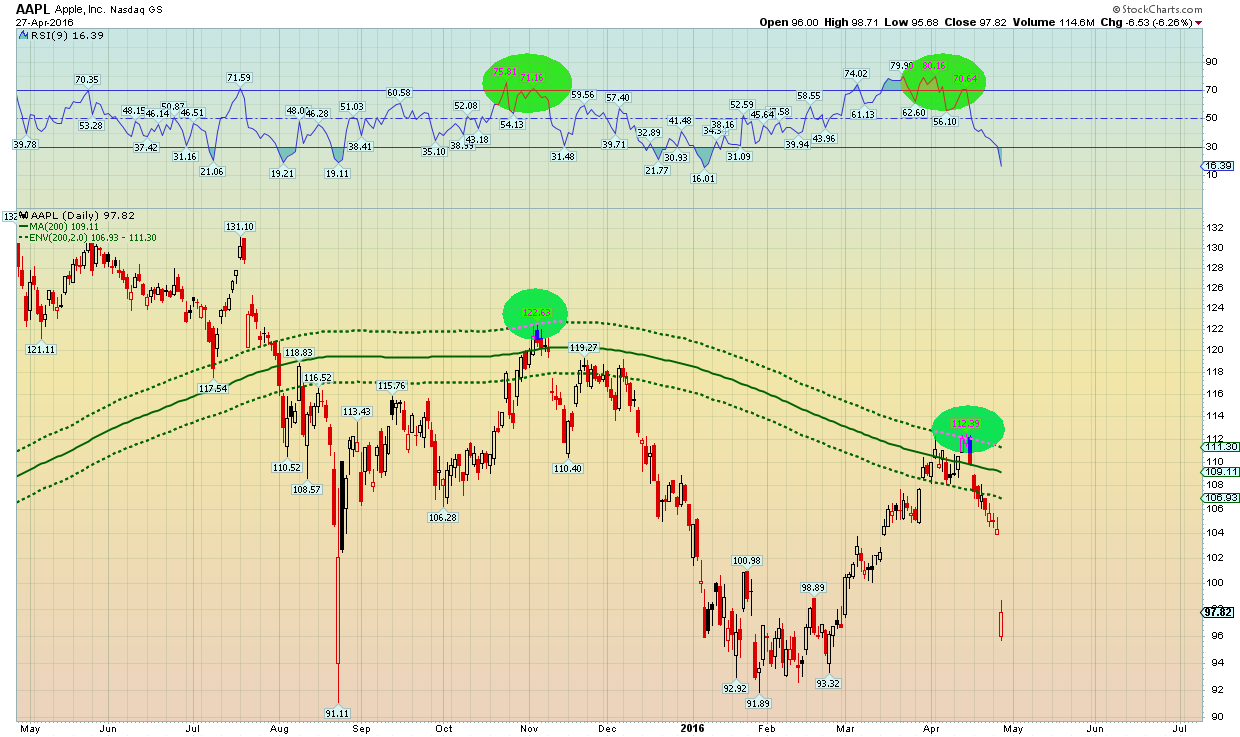
Every trade we look at takes into account the trend and the mean reversion force, and both must align for a perfect trade. The RSI9 was overbought and showing bearish divergences, thus confirming the sell signal.
The Cover
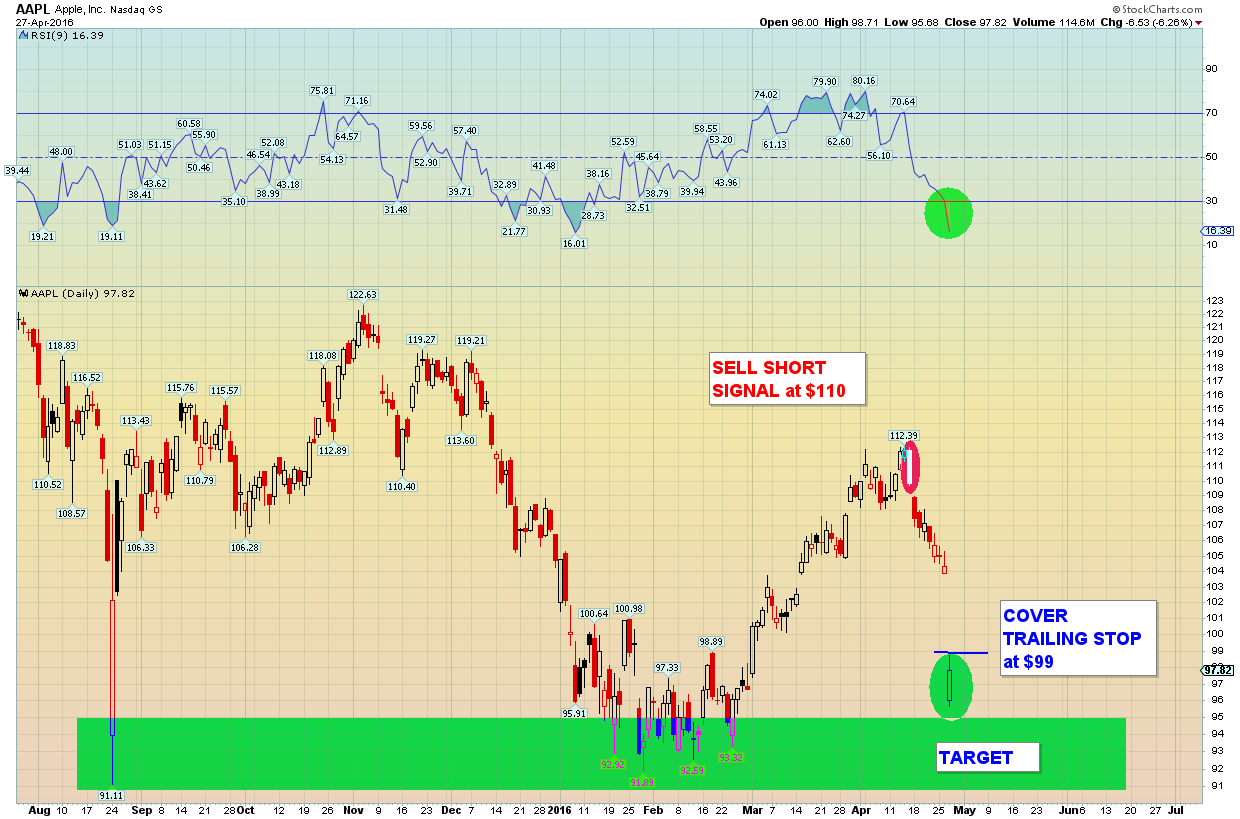
A buy stop above yesterday's high and a target in the winter lows area. Current valuation, no debt and overall sentiment becoming less bullish longer term are reducing potential catalysts for further deterioration.
Apple has transformed from a growth stock to a value stock. It has already happened while most investors were not aware of it. Could it re-invent itself? A new product or a smart acquisition? Perhaps. The price will show it.
Disclaimer: This is not investment advice. All information should be used for educational and informational purposes only.
