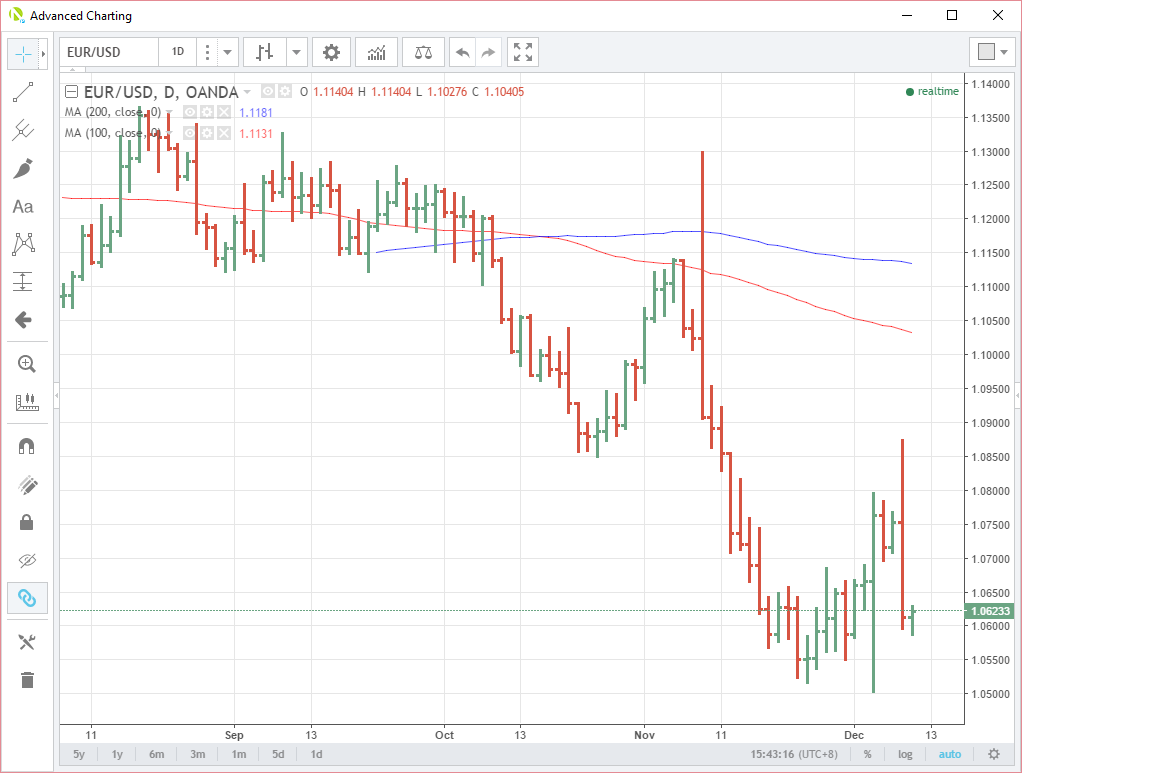
The ECB may have trimmed and not tapered QE overnight, but the EUR/USD itself is still looking very flabby today trading not too far from its overnight lows in a very very quiet Asia session. Part of this can be possibly explained by the huge amount of options expiries today in EUR/USD in the wholesale market. Bloomberg and Reuters show Eur 3.42 billion(bio) expiring today’s New York cut at 1.0600. There are further multi-billion EUR/USD expiries today each side of 1.0600 at 1.0500, 1.0525, 1.0575, 1.0650, 1.0700, 1.0750, etc. You get the picture. Without going into the nuances of the options market
Bloomberg and Reuters show Eur 3.42 billion(bio) expiring today’s New York cut at 1.0600. There are further multi-billion EUR/USD expiries today each side of 1.0600 at 1.0500, 1.0525, 1.0575, 1.0650, 1.0700, 1.0750, etc. You get the picture. Without going too much into the nuances of the options market, readers can safely assume there are a lot of bids and offers around in decent size keeping EUR/USD hemmed into a narrow range. Come 10 am New York time (the New York options cut) things may get a little more interesting.
Chart-wise the EUR/USD has made a series of lows in the 1.0505/25 region since mid-November. Technically this is shaping up as a crucial support area ith a daily and/or weekly close below 1.0500 possibly flushing out new downside momentum.
The hourly chart shows intraday resistance at 1.0640 before we get to daily resistance at 1.0875, yesterday’s high.
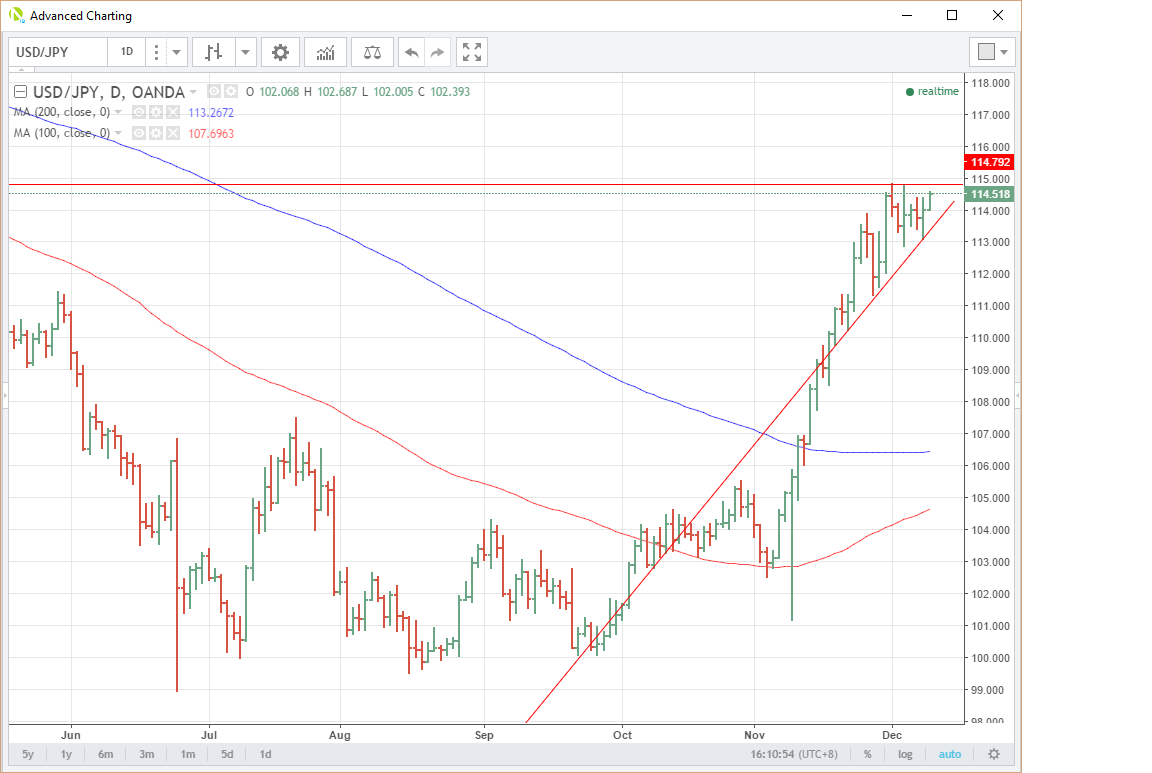
Received a boost today in Asia as US 10-Year yields ticked up over the session, proving that the yield correlation is well and truly alive and kicking. USD/JPY has resistance at the 114.80 area on the daily chart with support at 113.30.
The weekly chart shows a more cloudy picture, however. USD/JPY is still marooned inside the weekly Ichi moko cloud and the previously mentioned resistance at 114.80 combines with the 100-week moving average at 114.73 to create a formidable zone of resistance. Above there is the top of the cloud at 115.40. Support comes in at 112.90 the weeks low, and then 111.65 the bottom of the cloud.
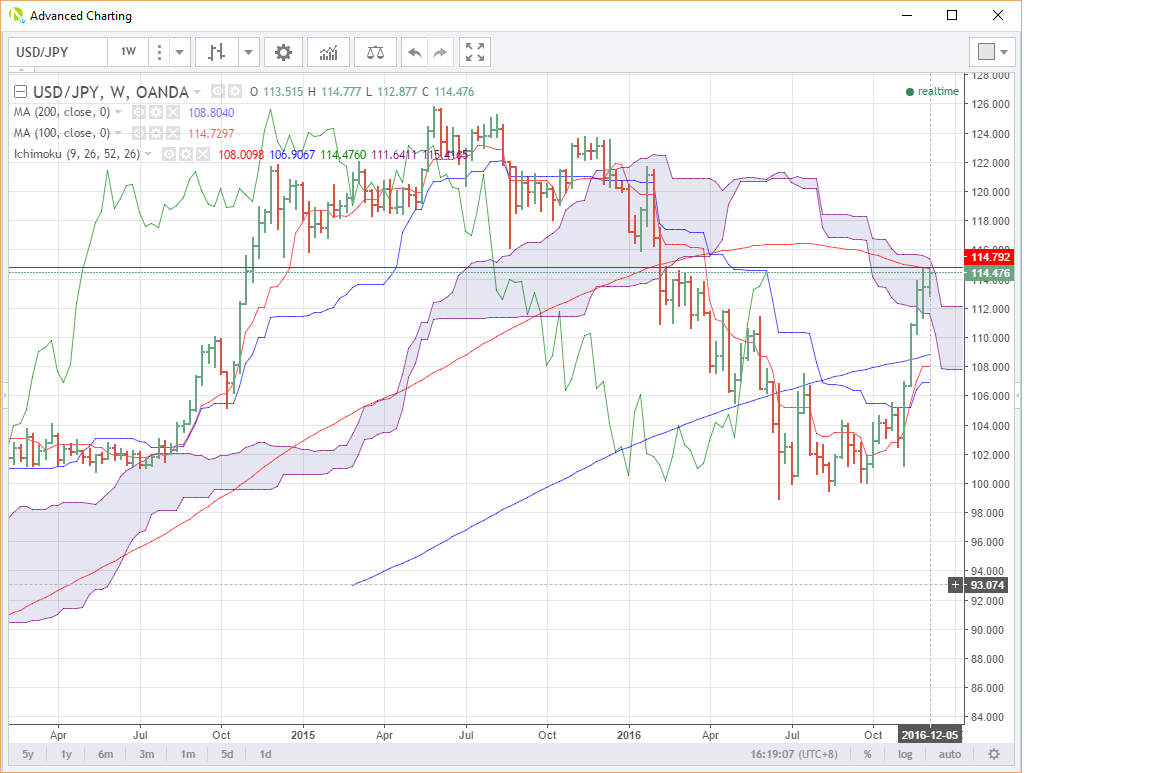
USD/JPY may well remain in this holding pattern until next week’s FOMC and/or another big move in US rates.
NIKKEI 225
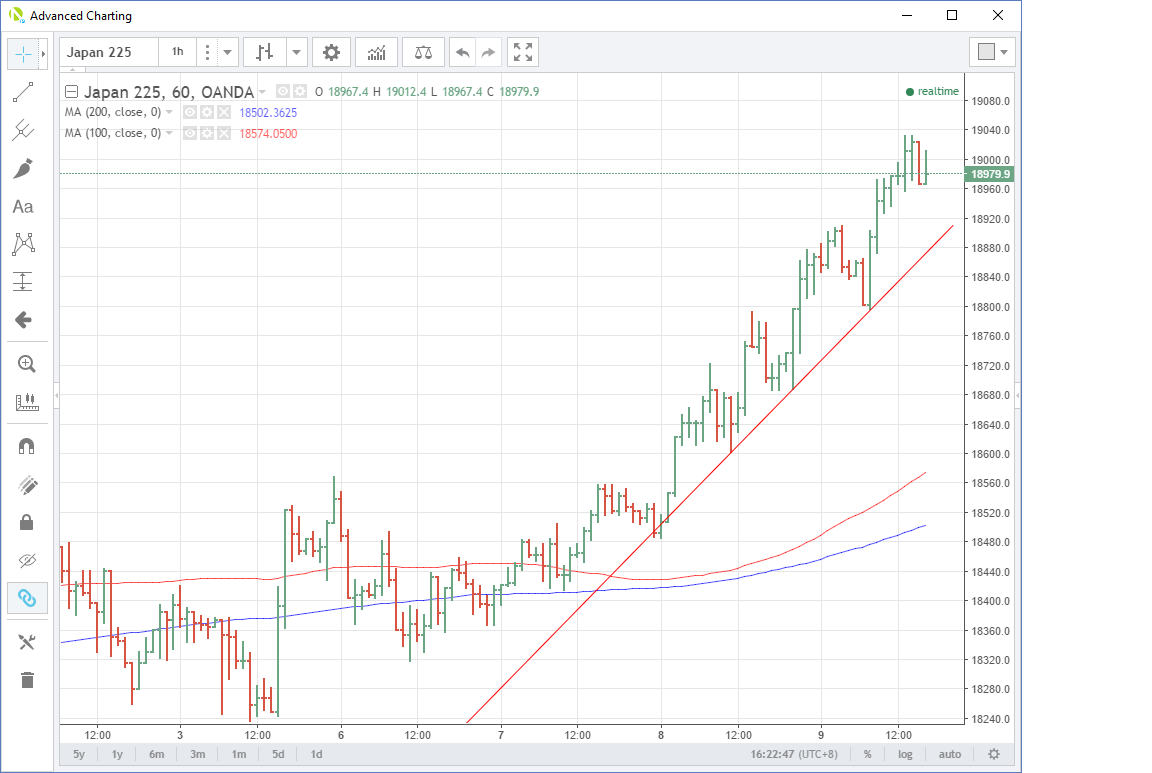
The Nikkei liked what it saw today though following the USD/JPY rally to the topside. Resistance is at the double top at 19030 with support at 18965 and then the trendline at 18875.
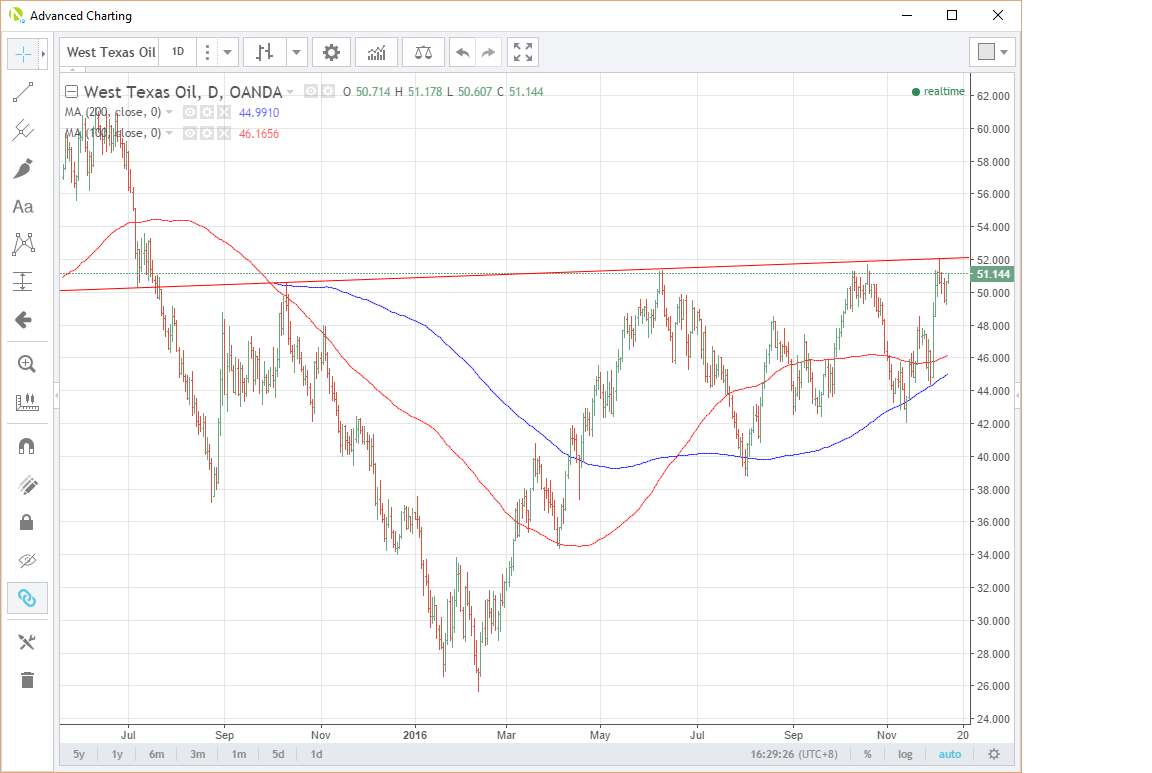
Crude could provide some sparks over the weekend. OPEC and NOPEC, well five of the Non-OPEC countries anyway, all meet in Vienna to thrash out the nuts and bolts of the production cut agreement. WTI has held well near the top of the post-agreement range but the daily chart shows a very nice resistance line at $52.10 a barrel going back to early September. Support lies at yesterday low at $49.25.
Given how headline driven oil is these days it wouldn’t take much to upset the applecart over the weekend so traders should be closely watching their news tickers for potential fireworks on Monday morning. Oil has come a very long way in a short time and on a technical basis, a break of that $49.25 level could turn a minor spill into a slick.
Summary
The quiet finish in Asia belies how calmly the market has negotiated an Italian Referendum and the ECB meeting this week. You wouldn’t think EUR/USD has had a 350 point range up and down at all. All talk seems to have disappeared off an Italian banking crisis and a Eurozone breakup, as quickly as it began last week. With the FOMC finally upon us, I suspect the calm won’t last as the market awaits either a dovish or hawkish hike.
