Get 40% Off
🚨 Volatile Markets? Find Hidden Gems for Serious OutperformanceFind Stocks Now

Another Reason The S&P 500 Could Reach 2500

Published 09/16/2014, 08:03 AM
Updated 05/14/2017, 06:45 AM

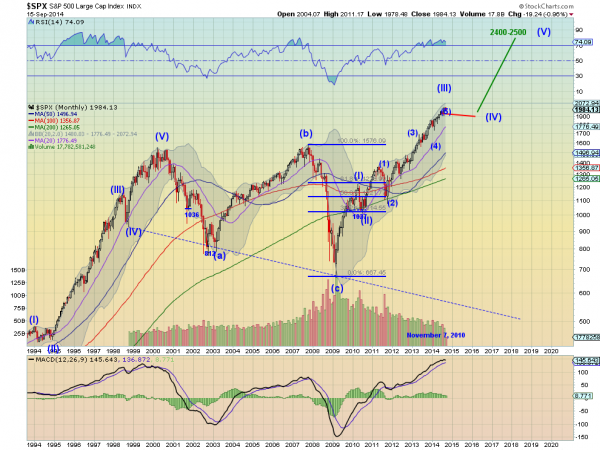
I spent a few minutes with Jeff Macke at Yahoo Finance last week talking about the S&P 500. I was a little afraid to meet him so I tried to be polite. In that interview I discussed how the current price action looked like consolidation on a longer term chart, but that 2390 was a good long term target. The full story and interview can be seen here. But there was one chart I left out because I did not want to scare him. Here it is.

SPX

The chart above shows the Elliott Wave interpretation of the S&P 500 since 1993. If you don’t know Elliot Wave Principles see a 5 Wave impulsive structure in the direction of a trend followed by a 3 Wave corrective pattern. Within both the 5 and 3 Wave patterns the waves alternate positive and then corrective. The pattern can then repeat or do something else. This 5 Wave pattern played out from 1993 to 2000 followed by a 3 Wave correction that ended in March 2009.

Since then the new 5 Wave impulsive pattern has been running and it looks like Wave III has just completed. Moving into Wave IV might then be scary and cause worry of a pullback, and it could. But another principle of Elliot Wave is that is Wave II is a corrective pullback, then Wave IV often corrects mainly though time. It is flat. The Final Wave V then would project higher approximately the same length as Wave I, or to the 2400-2500 area.

3rd party Ad. Not an offer or recommendation by Investing.com. See disclosure here or remove ads .

As it turned out Jeff Macke was a very nice guy and friendly. And I hope you see now that Elliott Wave does not have to be scary either.

Disclosure: The information in this blog post represents my own opinions and does not contain a recommendation for any particular security or investment. I or my affiliates may hold positions or other interests in securities mentioned in the Blog, please see my Disclaimer page for my full disclaimer.

Original post

Latest comments

Risk Disclosure: Trading in financial instruments and/or cryptocurrencies involves high risks including the risk of losing some, or all, of your investment amount, and may not be suitable for all investors. Prices of cryptocurrencies are extremely volatile and may be affected by external factors such as financial, regulatory or political events. Trading on margin increases the financial risks.
Before deciding to trade in financial instrument or cryptocurrencies you should be fully informed of the risks and costs associated with trading the financial markets, carefully consider your investment objectives, level of experience, and risk appetite, and seek professional advice where needed.
Fusion Media would like to remind you that the data contained in this website is not necessarily real-time nor accurate. The data and prices on the website are not necessarily provided by any market or exchange, but may be provided by market makers, and so prices may not be accurate and may differ from the actual price at any given market, meaning prices are indicative and not appropriate for trading purposes. Fusion Media and any provider of the data contained in this website will not accept liability for any loss or damage as a result of your trading, or your reliance on the information contained within this website.
It is prohibited to use, store, reproduce, display, modify, transmit or distribute the data contained in this website without the explicit prior written permission of Fusion Media and/or the data provider. All intellectual property rights are reserved by the providers and/or the exchange providing the data contained in this website.
Fusion Media may be compensated by the advertisers that appear on the website, based on your interaction with the advertisements or advertisers.
© 2007-2024 - Fusion Media Limited. All Rights Reserved.