Generally when the stock market enters a phase of volatile trading days I tend to sit back and try to remain calm. Market corrections are normal and come along more frequently than we often seem the recall, but when the volatility passes a new market phase will begin. However this new market phase may not be what we are expecting or hoping for, so as investors we need to be ready to adjust to this new reality.
The current turmoil sweeping the markets is not a surprise to me and back in March I wrote that I thought the S&P/ASX 200/All Ords were overbought and that a correction was near (see Shorting the Australian Stock Market, Oil & Soft Commodities).
That correction has now arrived and the S&P/ASX 200 Index and ASX All Ordinaries Index have fallen to just above 5000 (a level the market reached in 2006!). Considering they were both around 6000 earlier this year that’s quite a fall!
This current sell-off across a broad range of ASX stocks has been a little more severe than I anticipated, but just as trying to pick the precise top of the market is almost impossible, so is picking the bottom of a correction. Where a market correction will end nobody really knows… we just make the best guesses we can.
During a market correction it is important to filter out the media hype and focus on facts, so let’s look at a couple of long term charts of the ASX 200 and skip the short term noise for the time being.
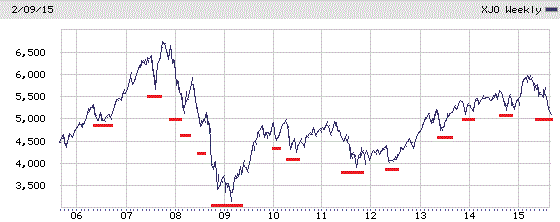
First let’s look at the 10 year chart of the ASX 200 and not surprisingly there have been quite a few corrections, pullbacks and slumps during this time.

On the ASX 200 chart above, I have highlighted some of the market pullbacks, corrections or falls over the last 10 years. Clearly the fall from the Australian stock market high in late 2007 until the market bottomed out in early 2009 is the dominant feature.
However, there have been plenty of other corrections, big and small, over the last decade and with that in mind, the current pull-back doesn’t seem to me (at the moment) to be that usual. So if we sit back and look calmly at this chart we cannot conclude anything about it apart from the current correction has sent the ASX 200 back down towards 5000. It may signal the start of a more severe correction, or more likely in my view, it’s yet just another correction.
One thing that has been consistent with every one of these corrections though has been the media reporting with the usual “Is it time to dump stocks?” or “Will the market meltdown continue?” type articles doing the rounds. It’s worth noting however that many of the reporters and commentators who write these stories were earlier in the year almost certain the ASX 200 was headed beyond 6000 because of the “strong” fundamentals of the Chinese economy. I have been bearish about the Chinese economy for some years and I don’t expect we have seen the end to economic slow down there.
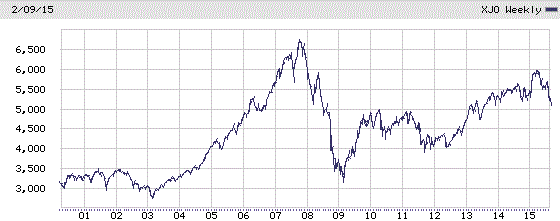
Next let’s have a quick look at the ASX 200 since it was started back in 2000.

I am simply including this chart to provide some long term perspective to the the short term view which is swirling around at the moment. Yes the current correction is unnerving, but in the overall scheme of things it’s just another bump on the road or as Peter Lynch once stated:
“You get recessions, you have stock market declines. If you don’t understand that’s going to happen, then you’re not ready, you won’t do well in the markets.”
I appreciate that short-term stock traders and those with exposure to margin calls may not share my “remain calm” approach to market corrections and I welcome their feedback. But from my perspective there is little to be gained from selling into a correction – the time to take some profits (or take short positions) was back when the market was near 6000.
So for now my approach is to pick up if possible, long positions in stocks or ETF’s that I have been watching for a while and I don’t expect to see a capital gain regarding these positions for 2-3 years.
In the meantime, a balanced stocks portfolio should provide a reasonable return via dividends and possibly as a bonus, a few companies may even surprise to the upside in the years ahead.
