Get 40% Off
🚨 Volatile Markets? Find Hidden Gems for Serious OutperformanceFind Stocks Now

EUR/USD: Caution On Thursday's Brexit

Published 06/21/2016, 01:59 AM
Updated 07/09/2023, 06:31 AM

EUR/USD

This rally comes from heavy demand seen near the trendline, which showed trend support. Over the next sessions, more buying supported higher prices, and Sunday’s gap provided a final push.

Reaching 1.14, it wasn’t able to breakout, and in the last hours, VSA showed minor supply in EUR/USD. I expect prices to close the gap and test the 1.120 – 1.125 area, which would be another opportunity to go long in this pair.

Caution on Thursday’s Brexit, which might be bearish for the euro if it wins, as investors would expect an economic downturn for one of the biggest EU economies, and therefore, less demand for euros.
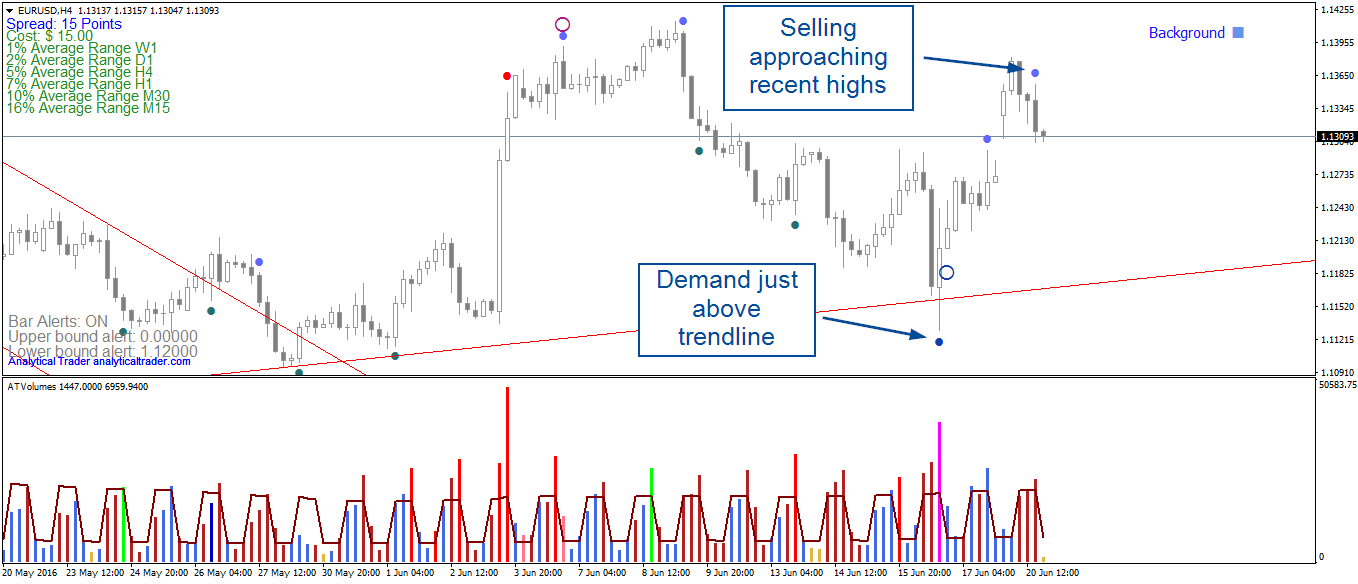
EUR/USD H4 Chart

GBP/USD

The pound is on a big rally as polls show the Remain vote is gaining ground against the Leave position. Looking at GU’s chart with volumes, we see that Pound was actually being bought days before this surge, on multiple days and sessions. At 1.432 it showed some congestion, possibly with many locked-in traders in the last high’s, selling at this point.

It continued to rally further and broke out what I believe it’s an important price, a long-term down trendline. The volumes continue to show buying, but with such extended prices, I would expect a correction soon. On a correction, a turn of the Dynamic Trend’s to green or low volume bars will provide a long entry opportunity.
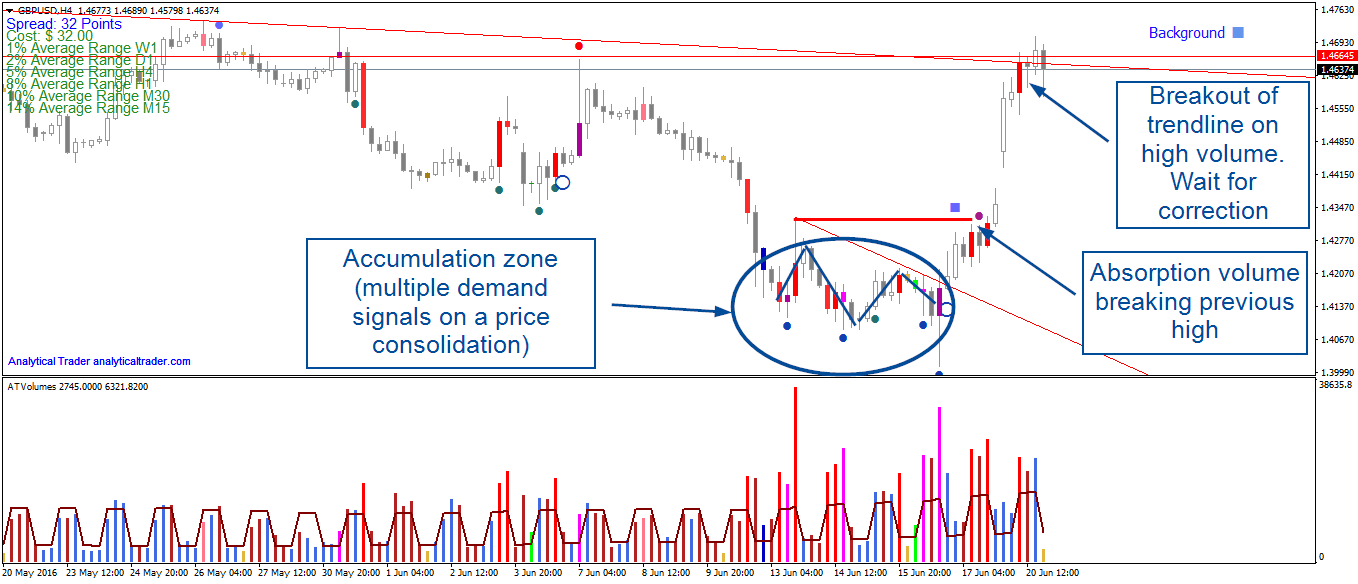
GBP/USD H4 Chart

USD/JPY

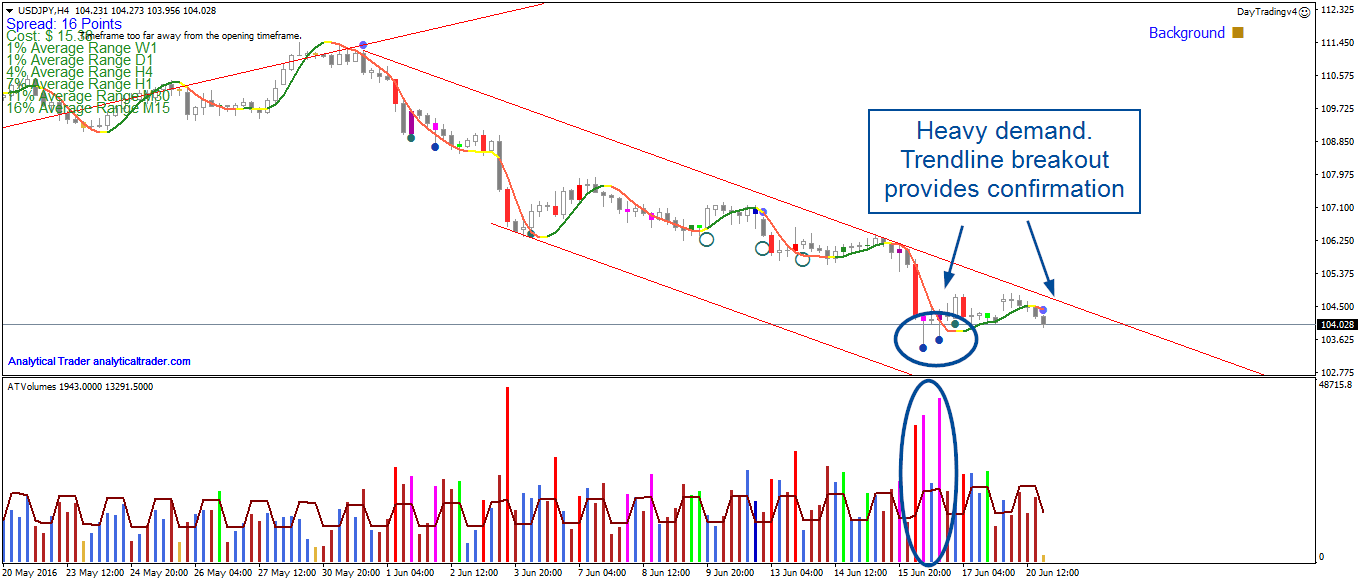
In USD/JPY we see various demand signals at this level, and a trendline break would be a good confirmation of the strength. For the time being, the background is weak, there’s a considerable downtrend behind, and I believe something more concrete is needed to be able to go long.
3rd party Ad. Not an offer or recommendation by Investing.com. See disclosure here or remove ads .

USD/JPY H4 Chart

USD/CHF

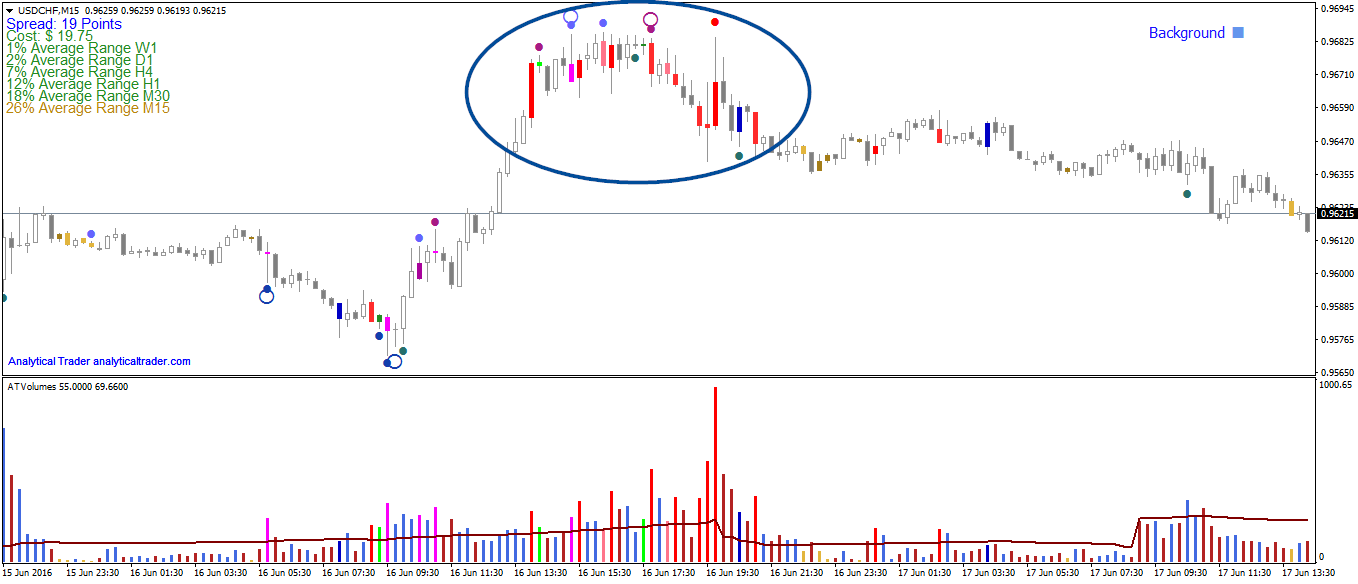
USD/CHF is also showing demand at these prices, though more modest. 0.967 is the level to watch for in this pair, since the high volume on that price (last red bar) suggests there are many sellers at those prices.

Every time there is a high volume bar, it’s good to check what happened in a lower timeframe, where VSA will show a clearer picture with the supply/demand signals. In this case, the picture below shows that bar actually showed supply. If there is more selling or low volume up bars near those prices, it will be a signal to short in M15/M30.
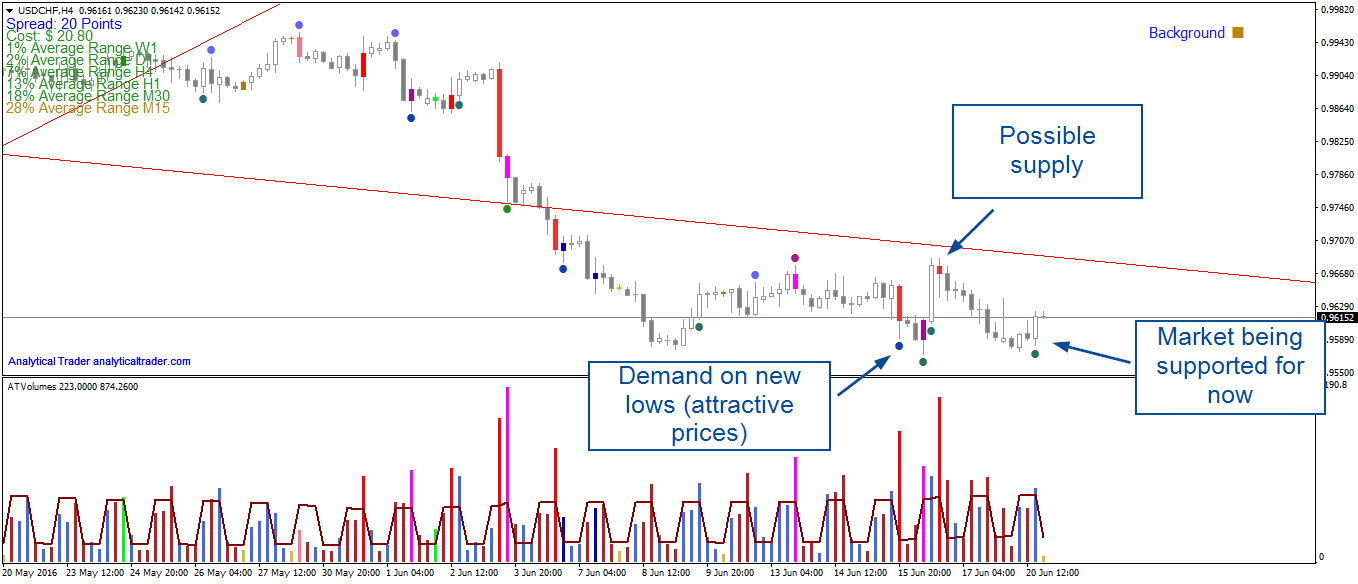
USD/CHF H4 Chart

USD/CHF M15 Chart

Latest comments

Risk Disclosure: Trading in financial instruments and/or cryptocurrencies involves high risks including the risk of losing some, or all, of your investment amount, and may not be suitable for all investors. Prices of cryptocurrencies are extremely volatile and may be affected by external factors such as financial, regulatory or political events. Trading on margin increases the financial risks.
Before deciding to trade in financial instrument or cryptocurrencies you should be fully informed of the risks and costs associated with trading the financial markets, carefully consider your investment objectives, level of experience, and risk appetite, and seek professional advice where needed.
Fusion Media would like to remind you that the data contained in this website is not necessarily real-time nor accurate. The data and prices on the website are not necessarily provided by any market or exchange, but may be provided by market makers, and so prices may not be accurate and may differ from the actual price at any given market, meaning prices are indicative and not appropriate for trading purposes. Fusion Media and any provider of the data contained in this website will not accept liability for any loss or damage as a result of your trading, or your reliance on the information contained within this website.
It is prohibited to use, store, reproduce, display, modify, transmit or distribute the data contained in this website without the explicit prior written permission of Fusion Media and/or the data provider. All intellectual property rights are reserved by the providers and/or the exchange providing the data contained in this website.
Fusion Media may be compensated by the advertisers that appear on the website, based on your interaction with the advertisements or advertisers.
© 2007-2024 - Fusion Media Limited. All Rights Reserved.