Gold aborted the head and shoulder pattern and made new cycle highs Friday. This development severely dampens the chances of new lows in gold and silver as previously forecast. I would say the odds support an 80% chance that the 8-year cycle in metals bottomed, and a new bull market has begun. However, buying now at 52-week highs and 22-weeks long into a cycle would be dangerous.
Since gold made new highs, I expect it will now reach at least $1,315-$1330, and silver will probably test $18.25-$18.70 next week. The HUI is almost to the 200-week moving average, and 250-260 seems like a logical target. The US dollar is toast; it hasn’t completely broken the support levels, but prices will challenge the 92.50 low next week and probably fail.
THE BAD NEWS
It is looking like I missed the arrival of the 8-year cycle low in gold, silver, and the miners. I was expecting either a price capitulation (selling climax) or a major reversal within the 8-year cycle timing window. Until now the earliest Major Low arrived 2-months before a Presidential election. Therefore, it was unlikely the low would arrive a full year prior; history was made with the shortest cycle recorded. My best guess is negative interest rates around the globe caused the 8-year cycle to terminate prematurely.
There is still a 20% chance the low is still ahead, but that number trends lower each day we don’t have a correction. We must wait for the charts (prices) to correct below their 10-week moving averages in metals and miners to look for the next opportunity to enter long positions.
THE GOOD NEWS
It’s difficult to forecast major turning points; I would rather get in after a bottom has formed than entering too early. If the 8-year cycle bottomed then the fact that gold stayed above $1,000 and silver kept above $13.00 is extremely bullish for prices going forward. Our $8,500-$10,000 targets in gold should be achieved by 2021-2024 and $300-$500 silver is very probable.
It’s human nature to want to get in at the exact bottom or out at the exact top, the probabilities are not even worth entertaining. Be patient, there will be hundreds of opportunities over the next several years to make lots of money as metals and miners soar ever higher.
US DOLLAR QUARTERLY- If the 16-year cycle topped prices should decline until 2021-2024.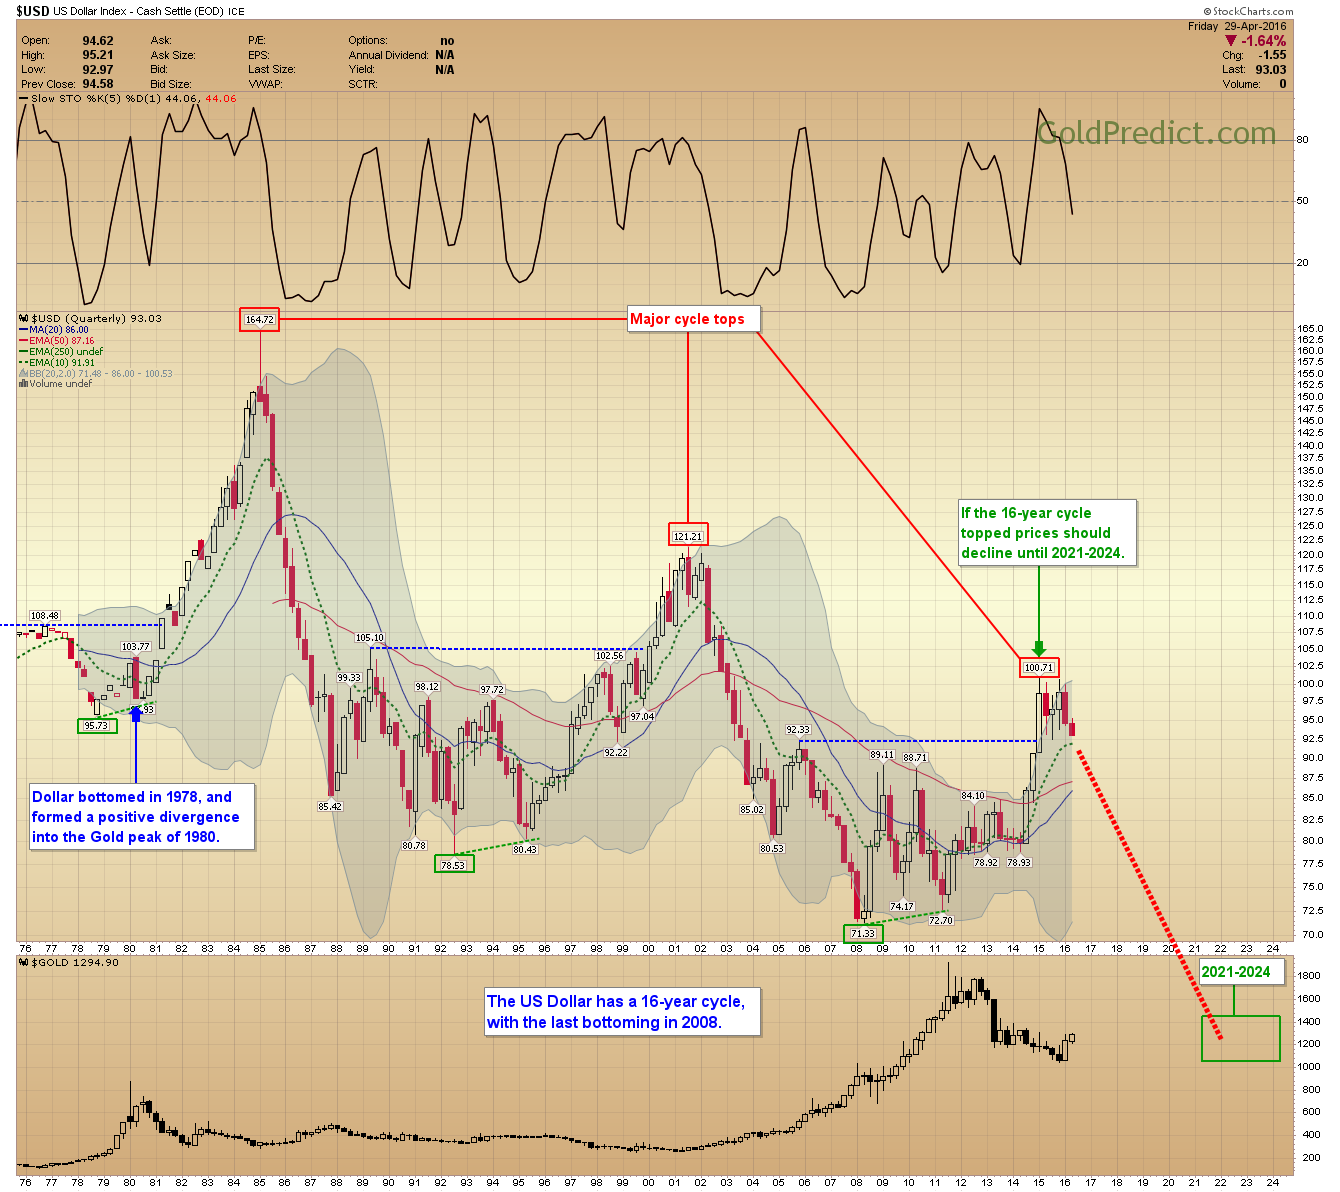
US DOLLAR WEEKLY- A close below the lower boundary will mark 100 as a double top.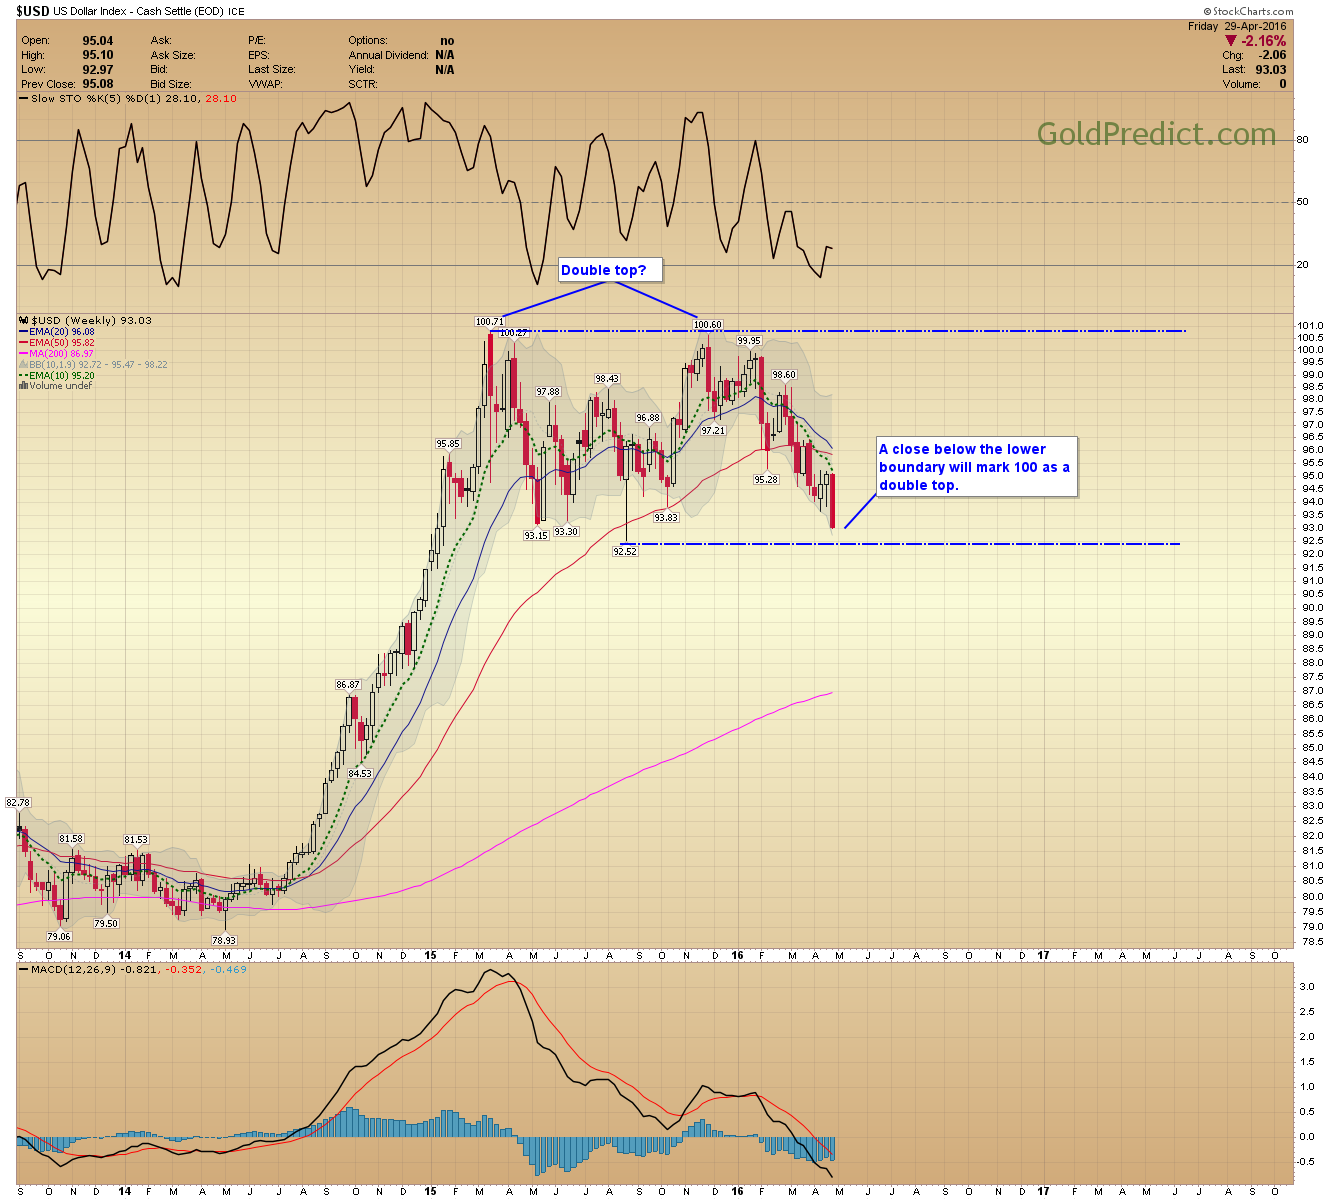
US DOLLAR DAILY- The dollar is dropping like a rock, the MACD (below) failed to signal a breakout, and I had to redraw the trendlines.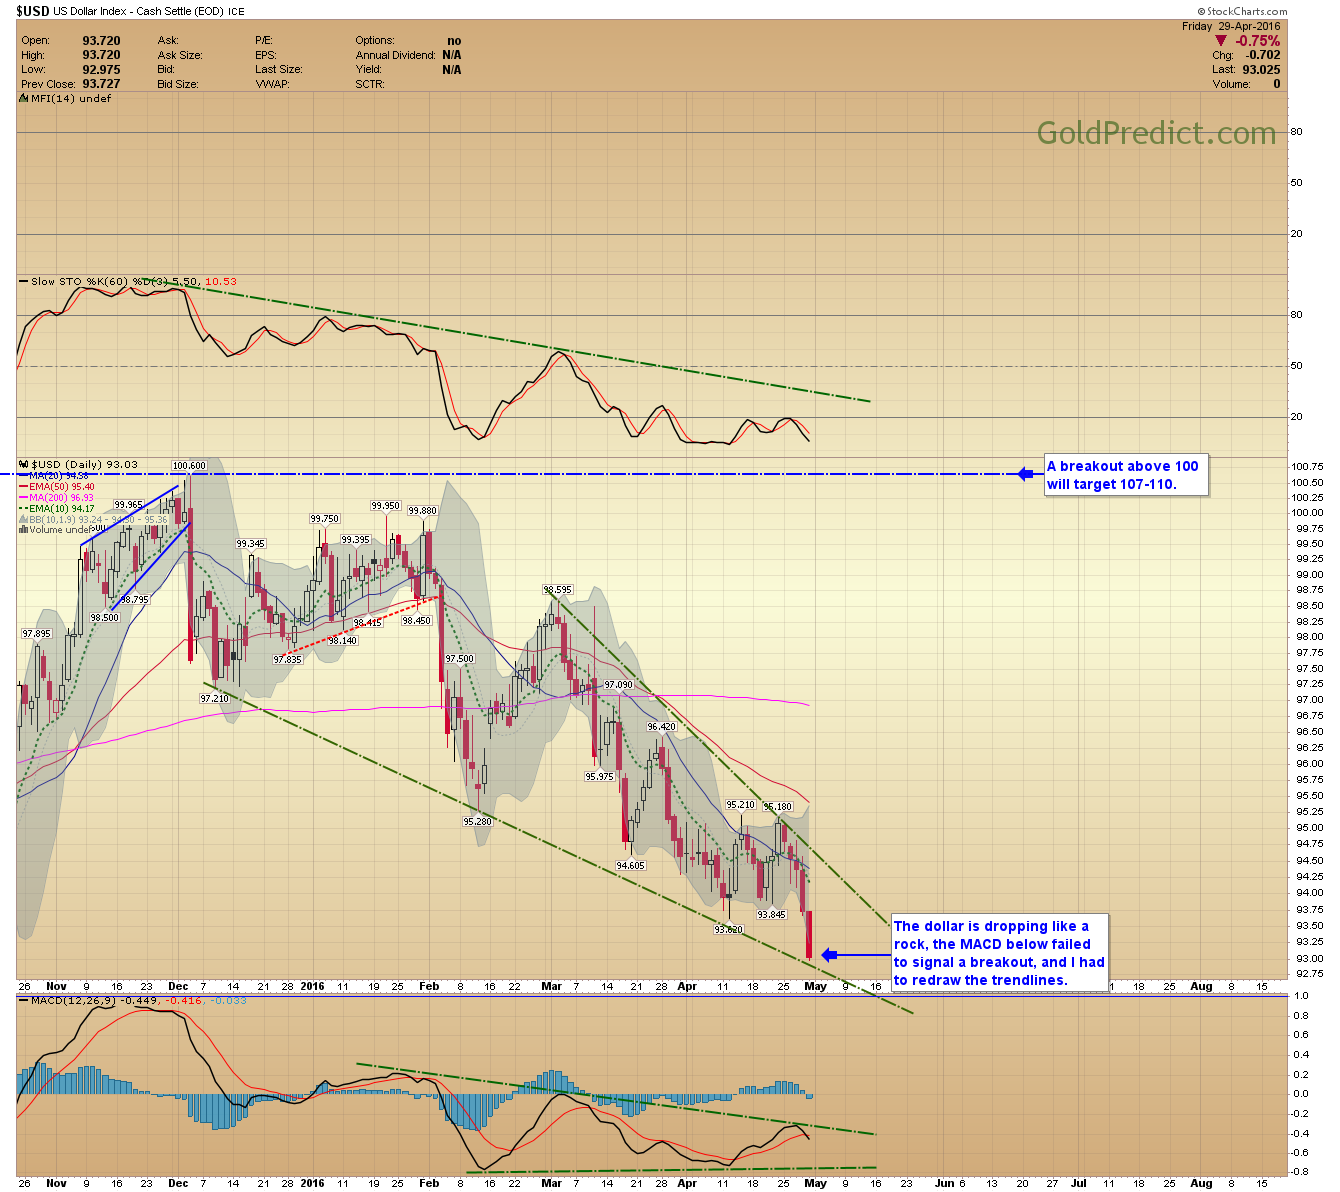
GOLD QUARTERLY- I still want a close above the 16-quarter average to confirm the 8-year low. It might take a couple of years before prices breakout above $2,000, but when it does, hold on.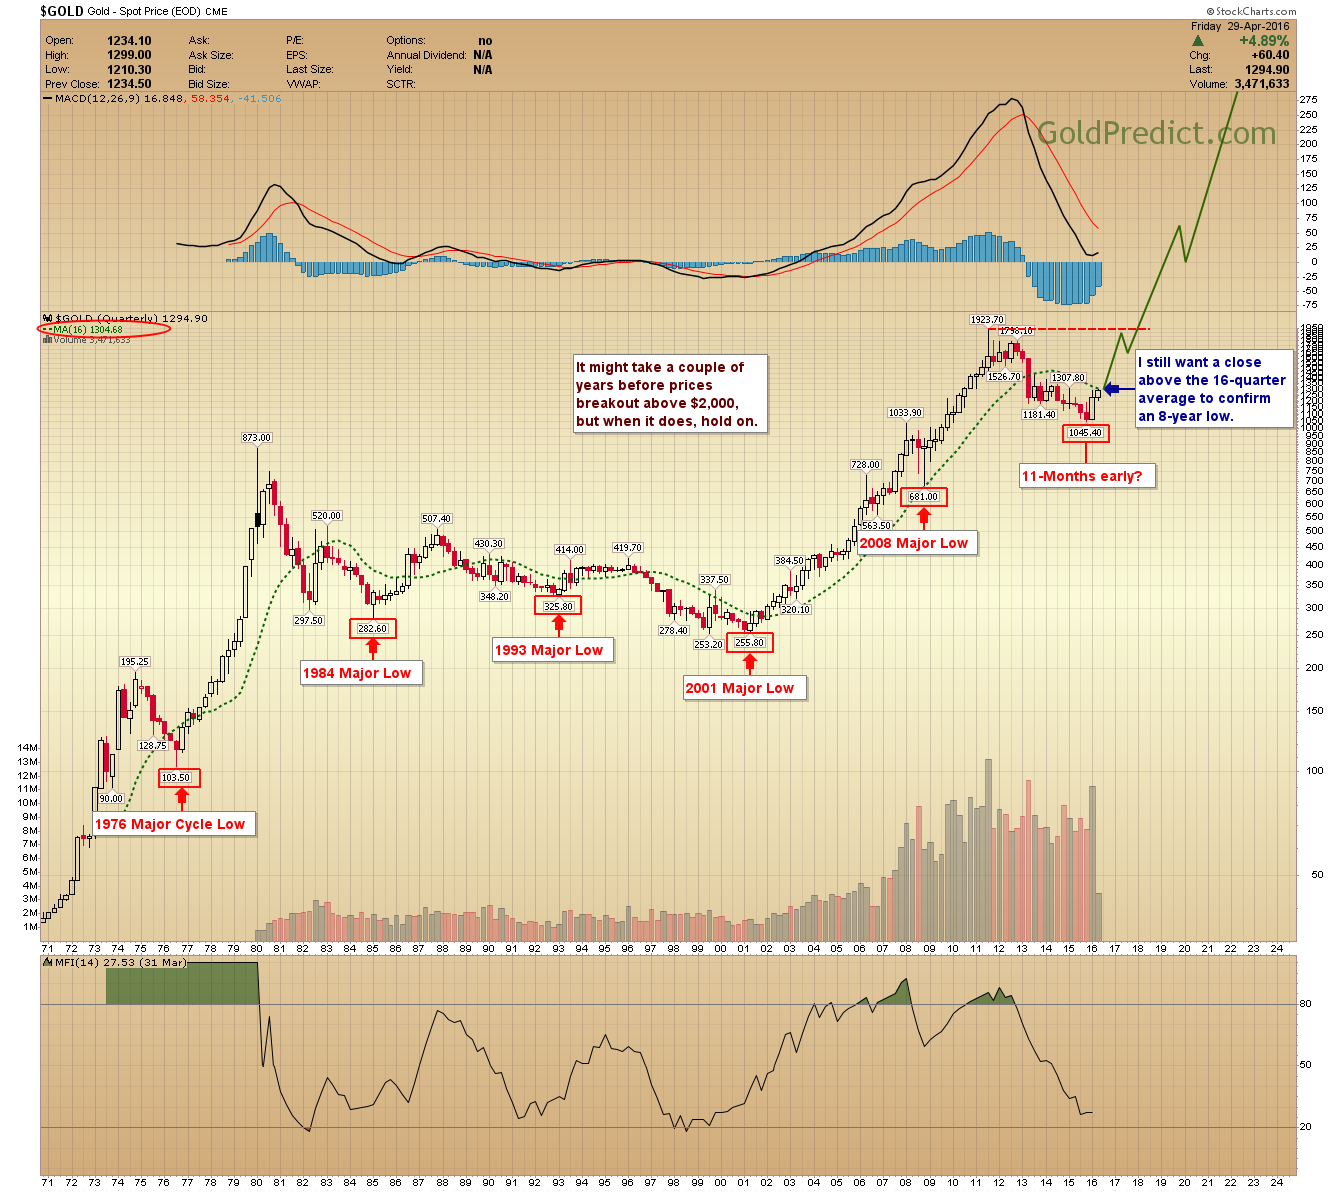
GOLD WEEKLY- At 21-weeks gold made a new high and will likely attack the 200-week moving average before dropping to a 6-month low. The color code has changed back to a yellow caution flag.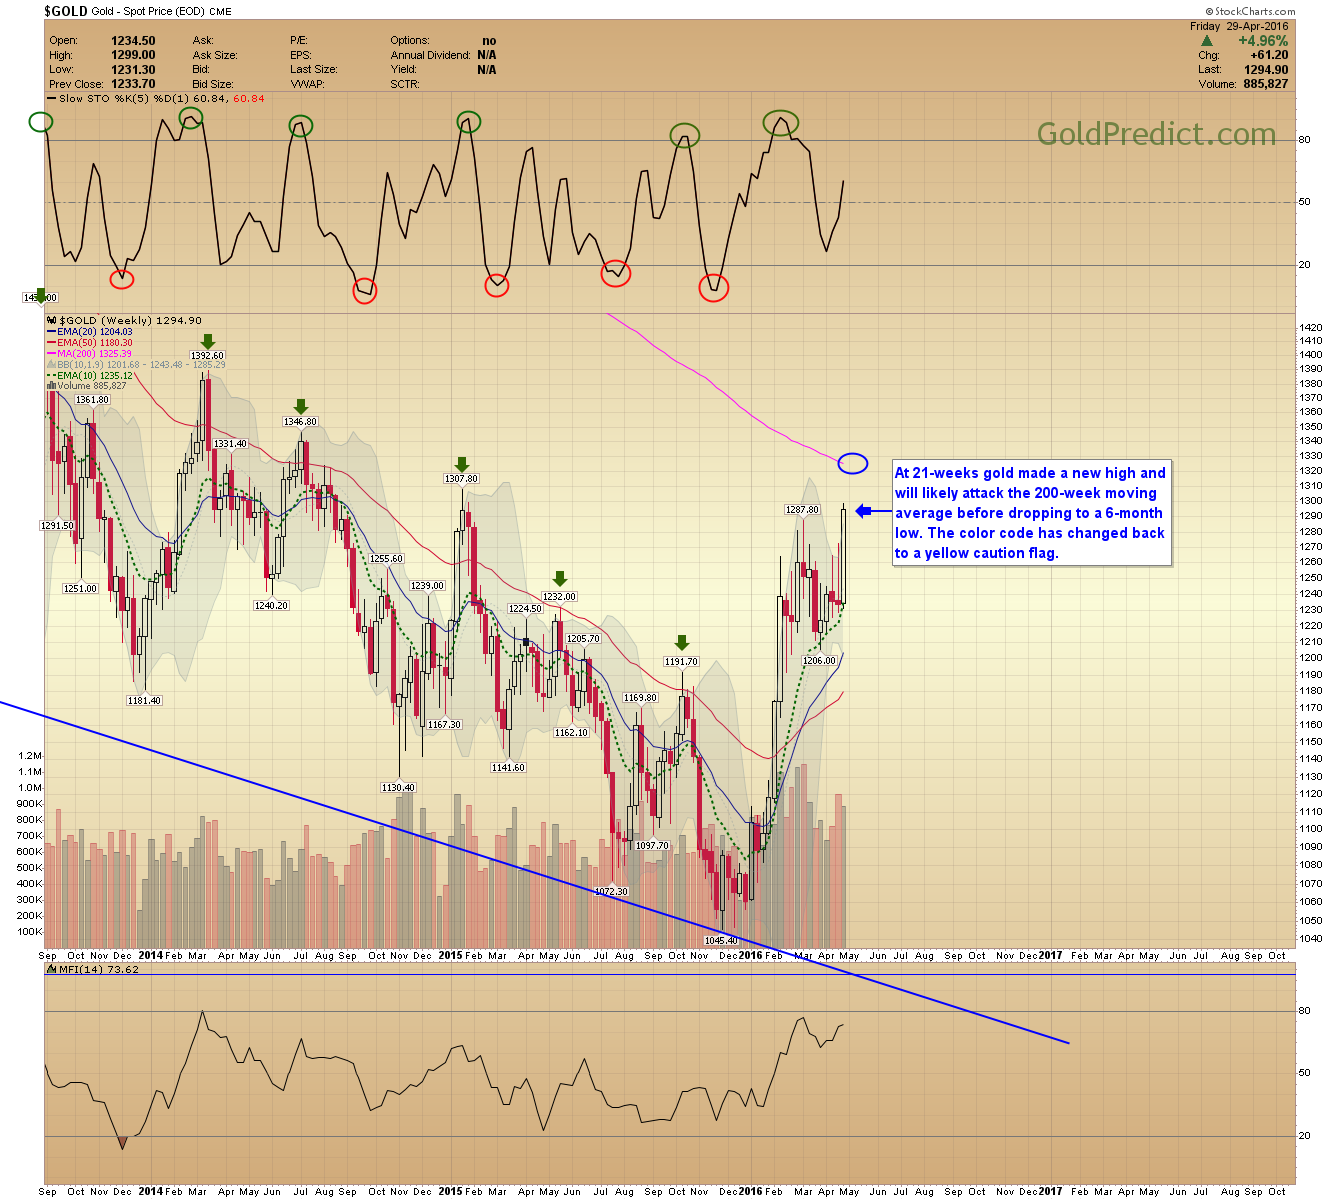
GOLD DAILY- Prices broke out to new highs after a sideways consolidation. It is very late in the cycle, but prices will likely challenge the 200-week MA at $1,325.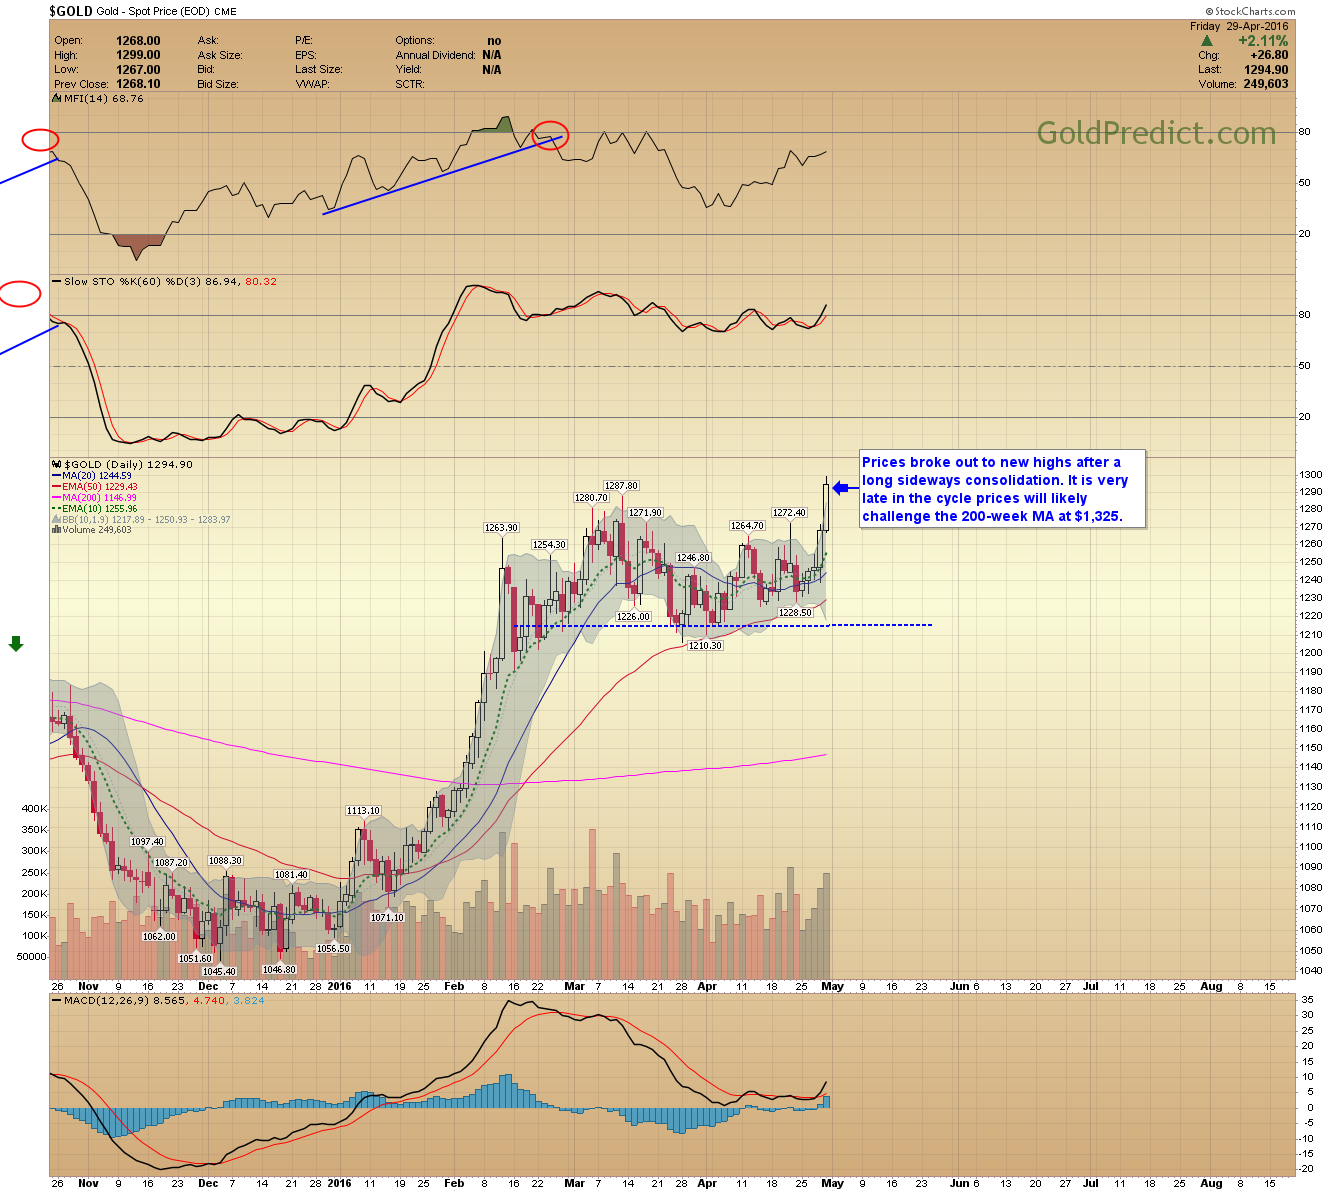
RATIO- The gold:silver ratio is at stiff support between 68-71, prices need to break below to confirm the 8-year bottom low.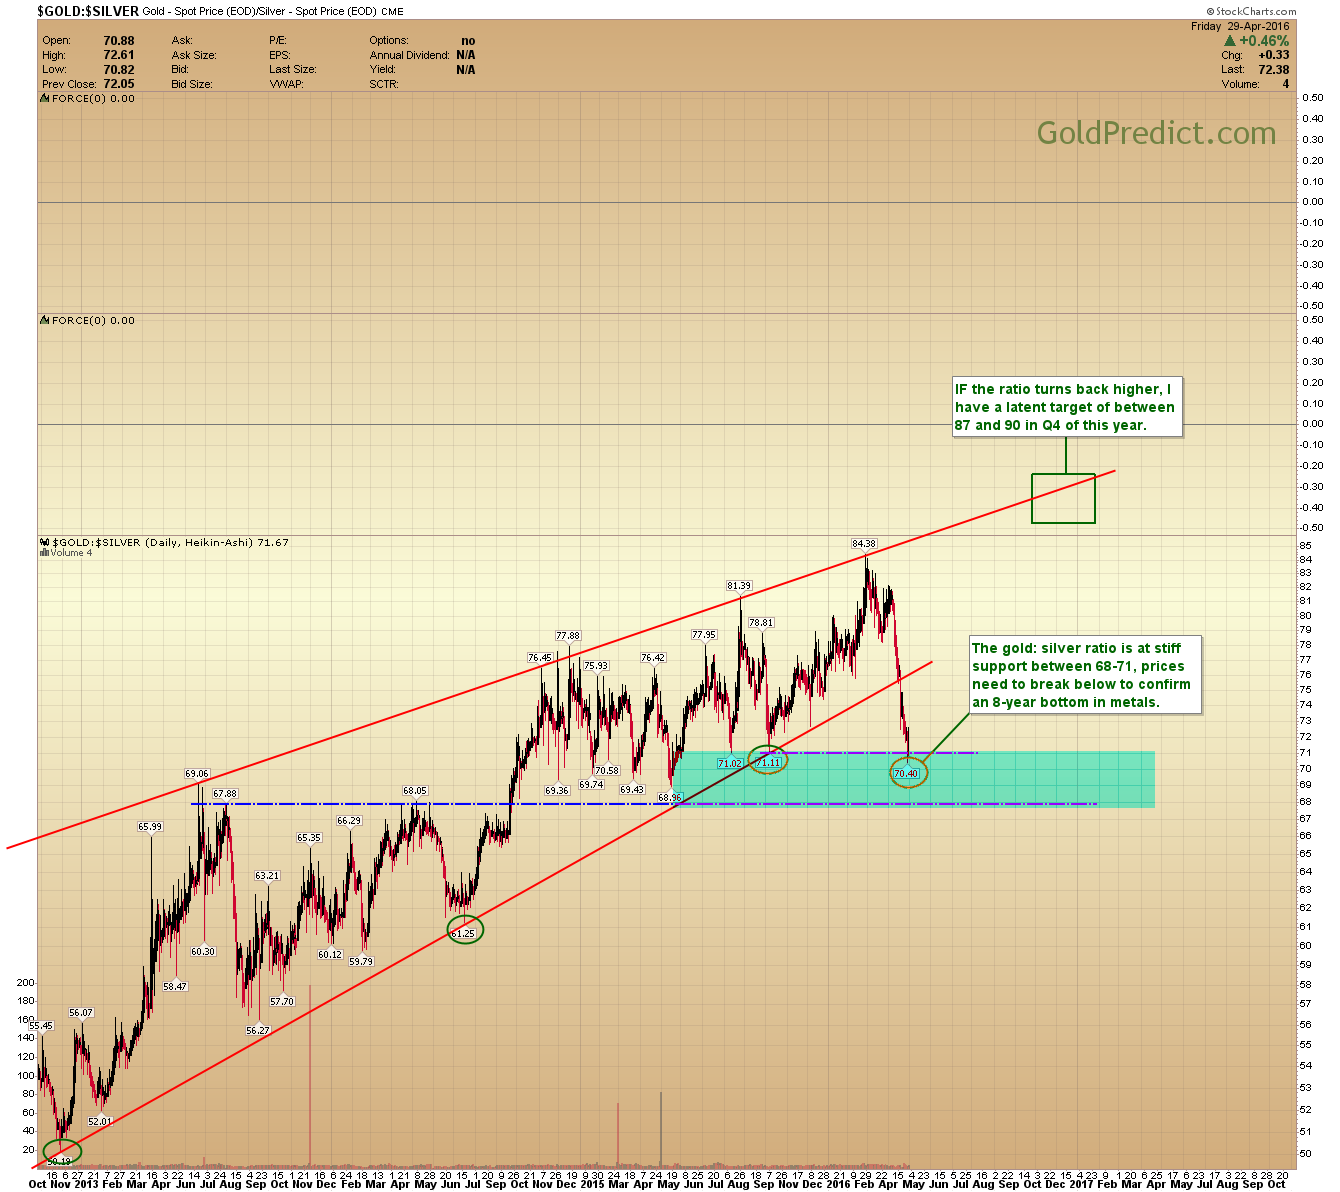
SILVER QUARTERLY- If the 8-year cycle bottomed at $13.62 then it may take a couple years before there is a breakout above $50.00. Major resistance levels at $19.00/$20.00, then $25.00/$26.00 and $35.00/$38.00 along the way.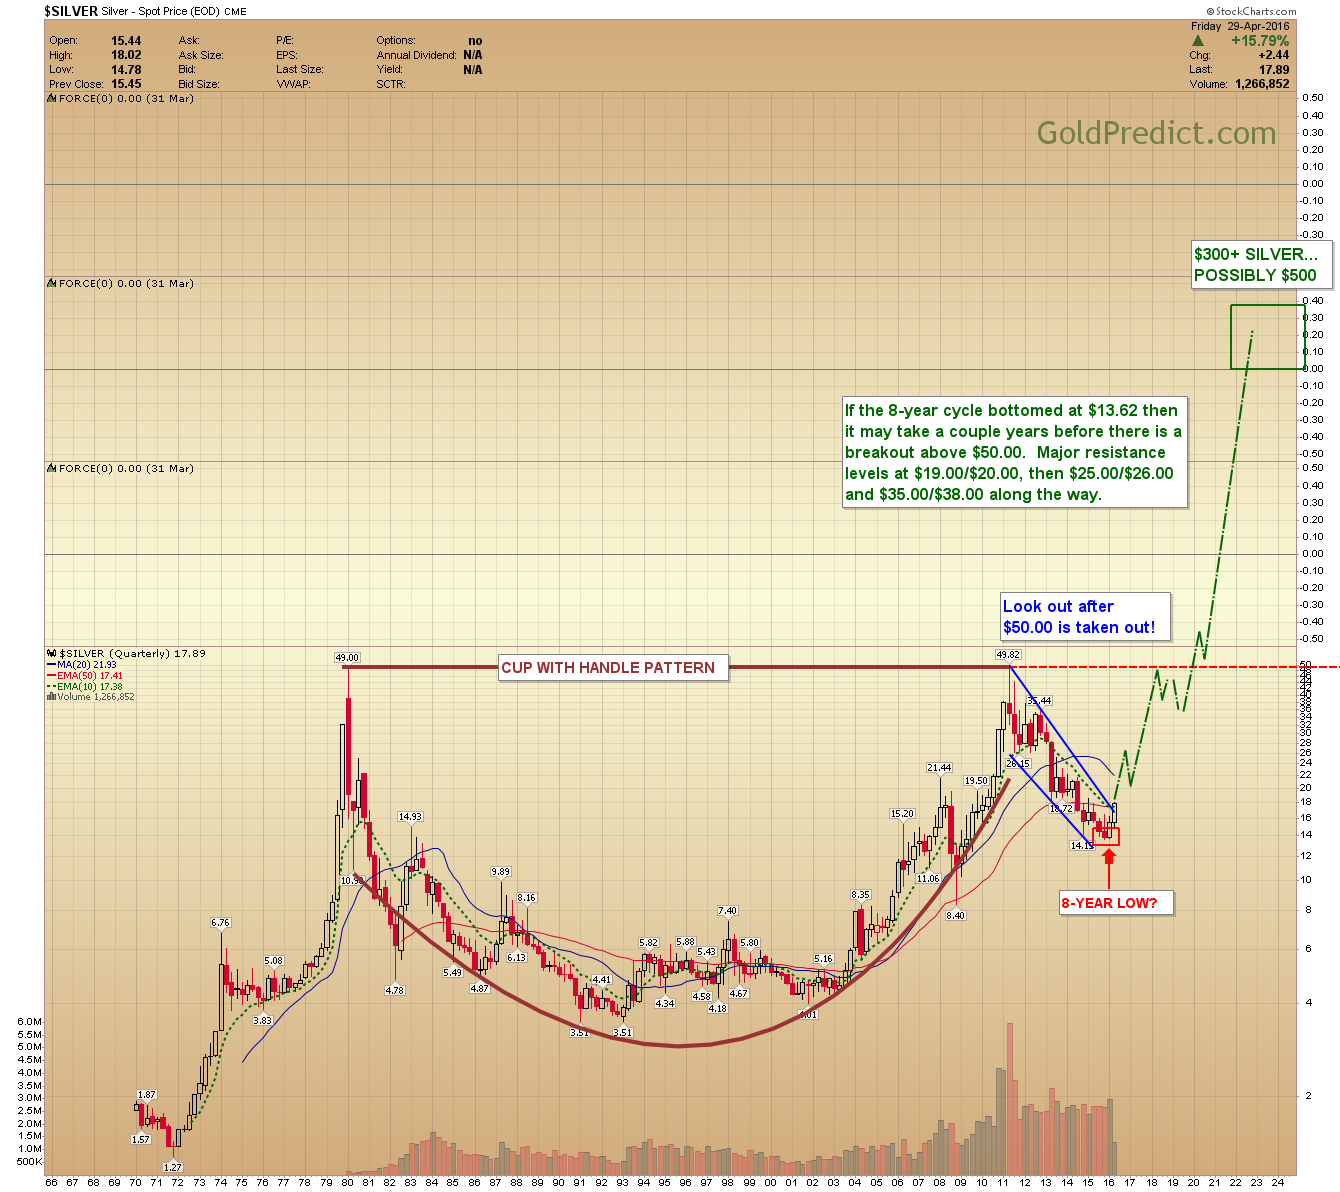
SILVER WEEKLY- Silver has a big test coming between $18.50-$19.00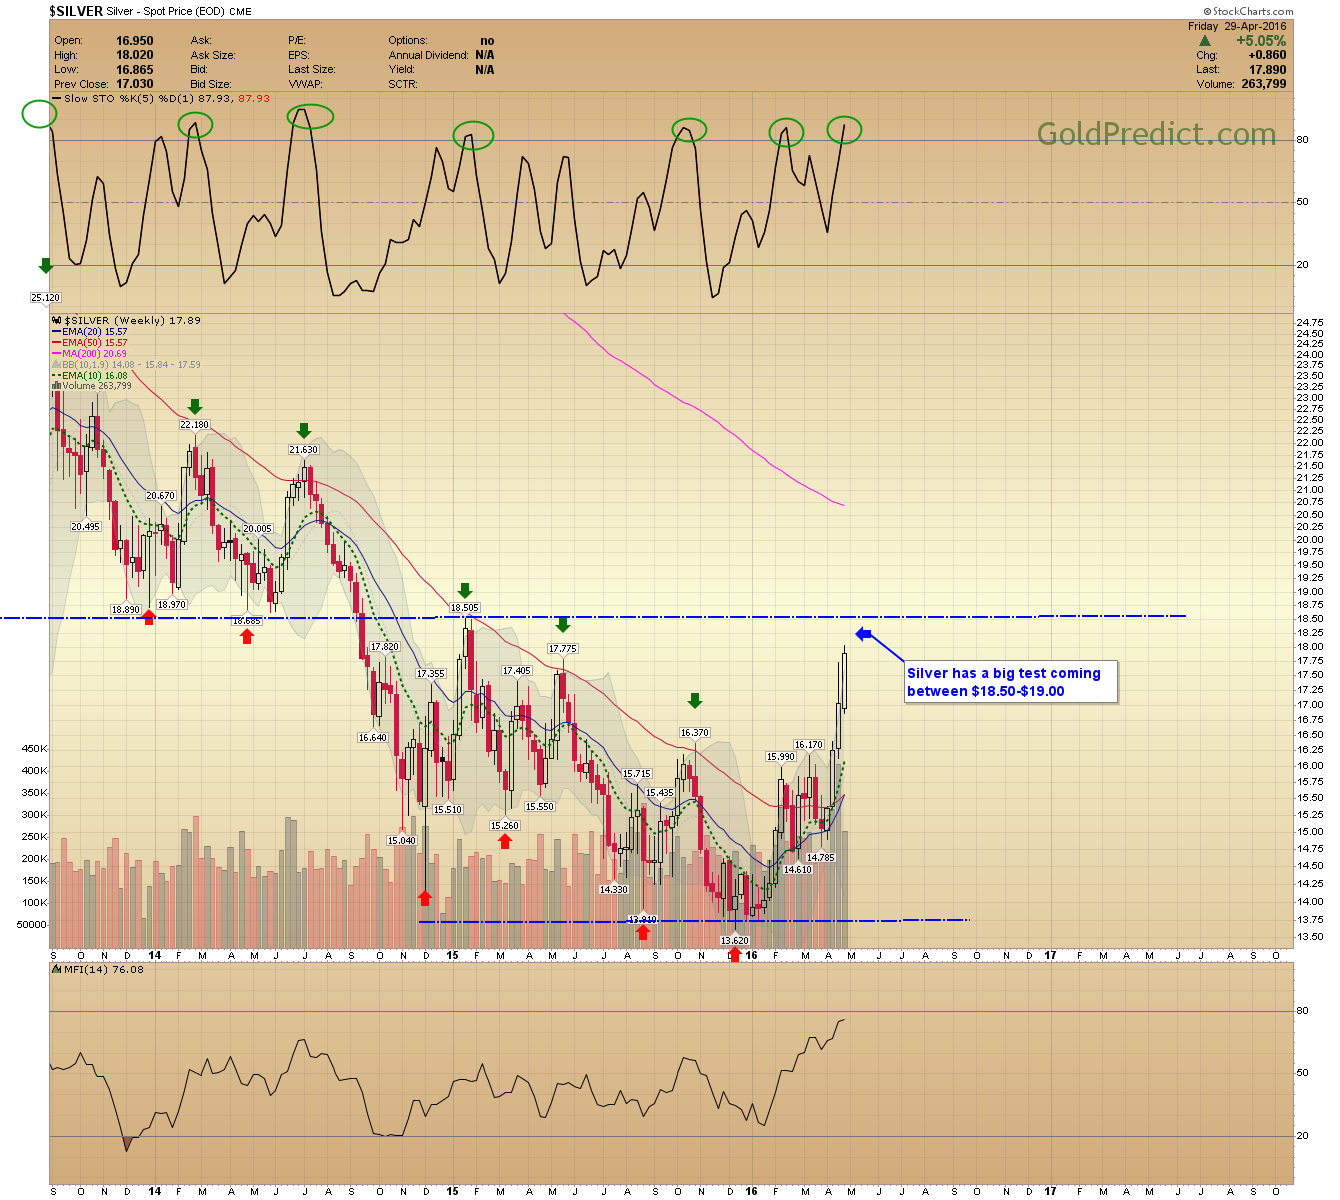
HUI WEEKLY- Price is almost at the 200-day moving average, 250-260 seems likely.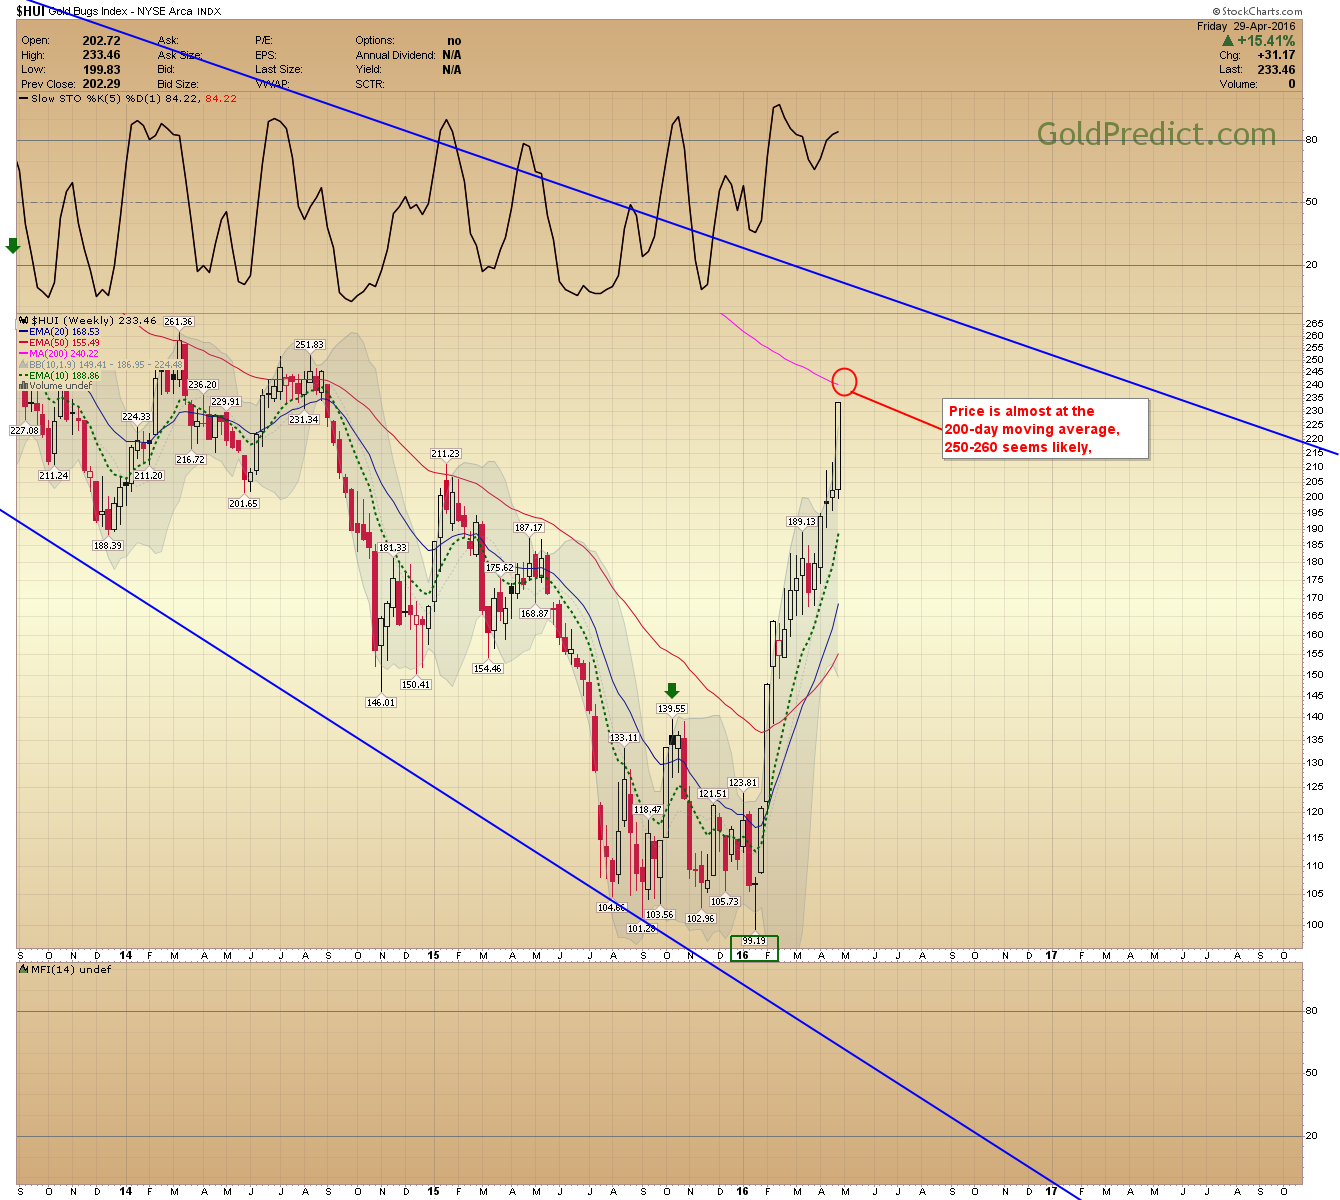
SPX- Prices made a confirmed price swing and may be setting up for further declines.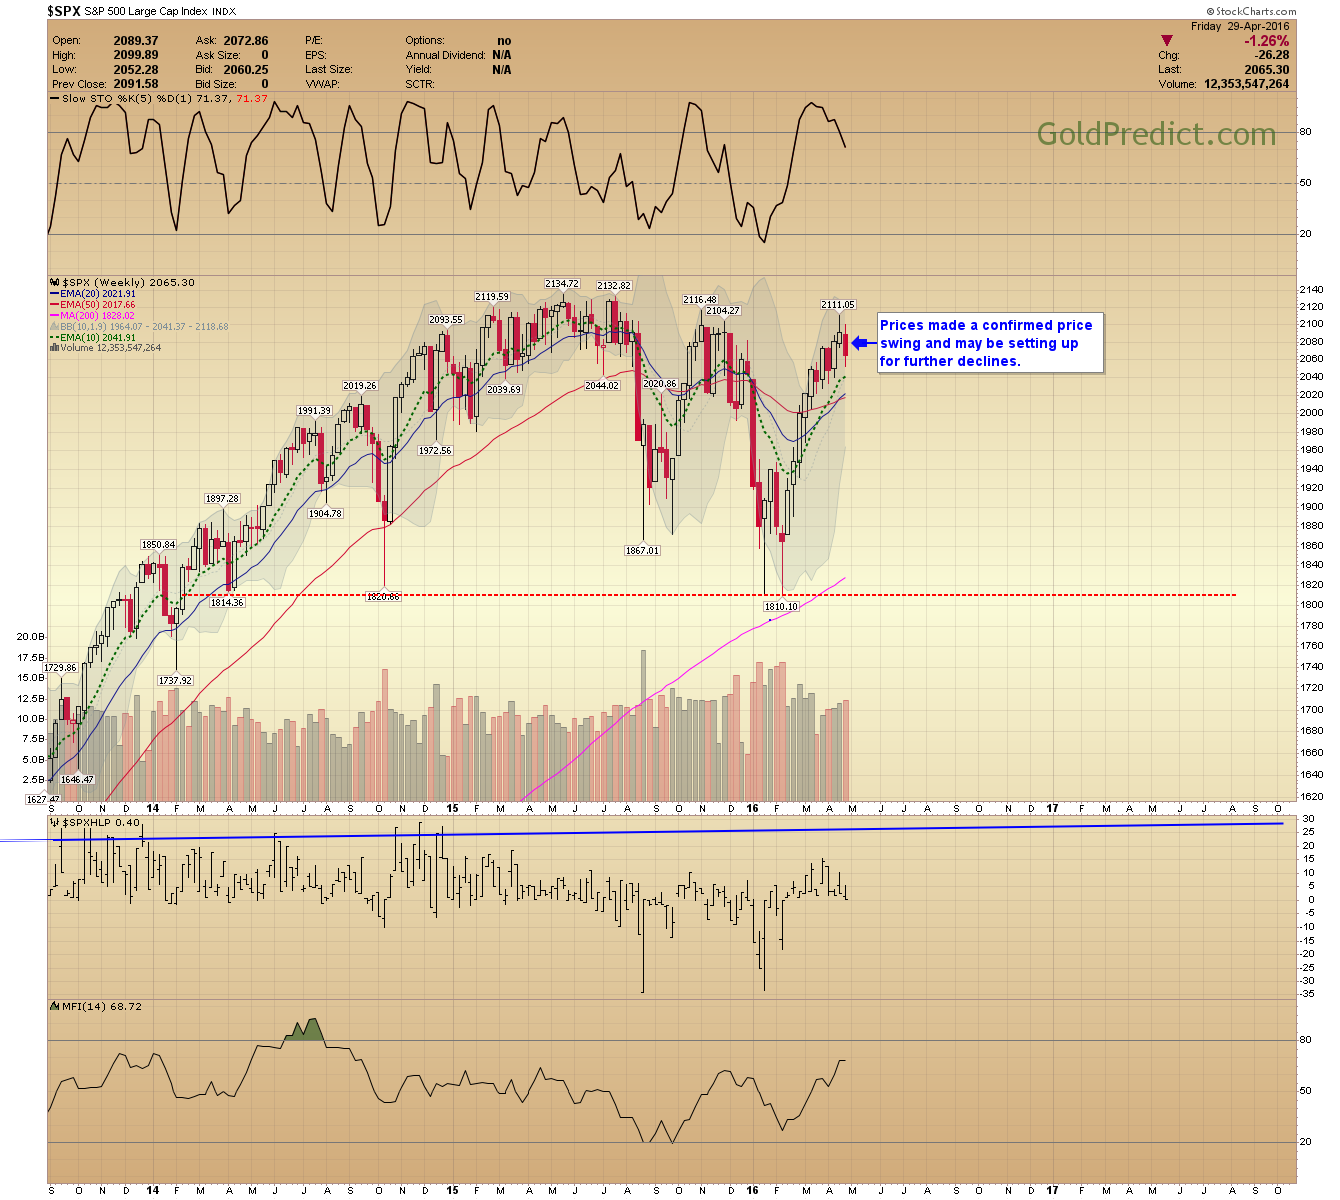
I will try and get all three color codes (miners, silver, and gold) displayed in the next week or two. Gold switched to a yellow caution flag and if prices falter around $1,325, the 200-week MA, a red one-star sell signal might get triggered.
