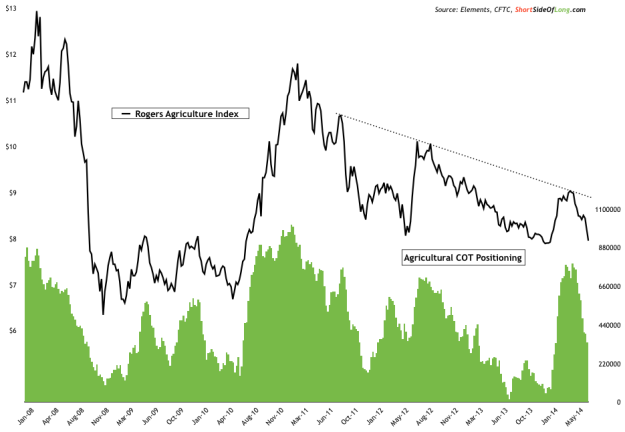
Chart 1: Agricultural prices have completely reversed this year's rally
Agricultural commodities from Wheat to Soybeans, and from Sugar to Cotton, are going through extremely strong selling pressure as I write this. Everything is being thrown out, the baby together with the bathwater, in what appears to be a forced liquidation.
Keep in mind that Commitment of Traders positioning by hedge funds, shown in the chart above, has lagged by a whole week. It will be very interesting to see how many funds will stay net long after this recent panic selling episode.
Chart 2: Grains have been hit the hardest in an ongoing panic sell off
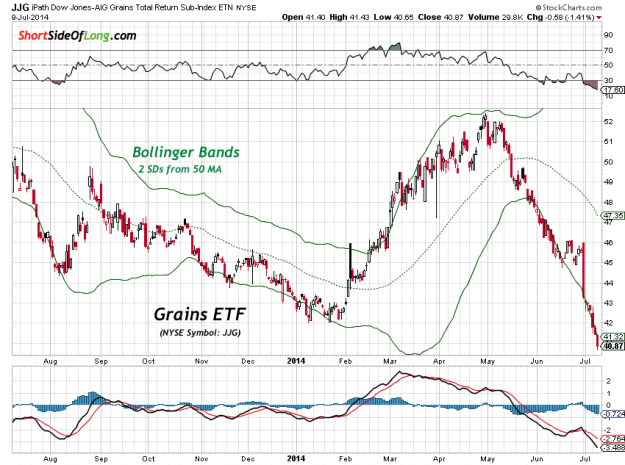
While almost all agri-commodities have been under selling pressure since May of this year, grains really stand out as the asset class that has been beaten down the most. The iPath DJ-UBS Grains Subindex TR (NYSE:JJG), also known as the grains ETF is currently down 22% in just two months, as the price trades more then 2 standard deviations below its mean, on what appears to be a rock bottom oversold technical condition.
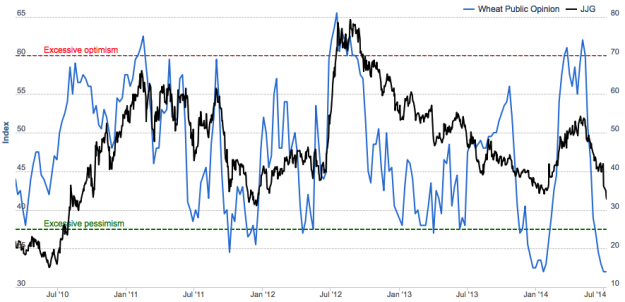
The mood within the sector also smells of panic. Sentiment on various grains is now approaching rock bottom. Chart 3, below, thanks to SentimenTrader’s website, shows that public opinion on Wheat has now fallen to one of the lowest levels in decades. There are now hardly any bulls left.
Chart 3: Currently, sentiment on grains has reached multi-decade lows
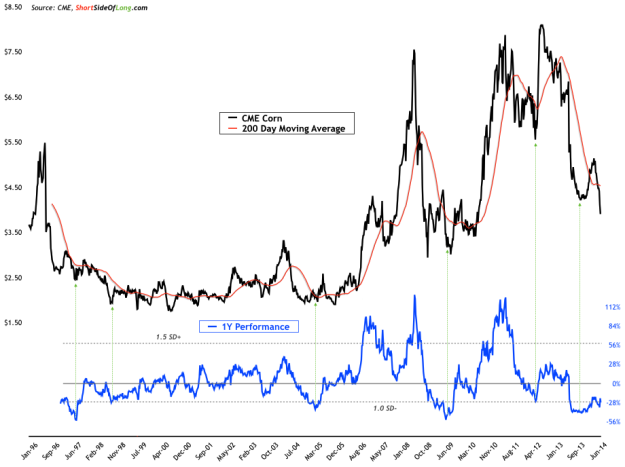
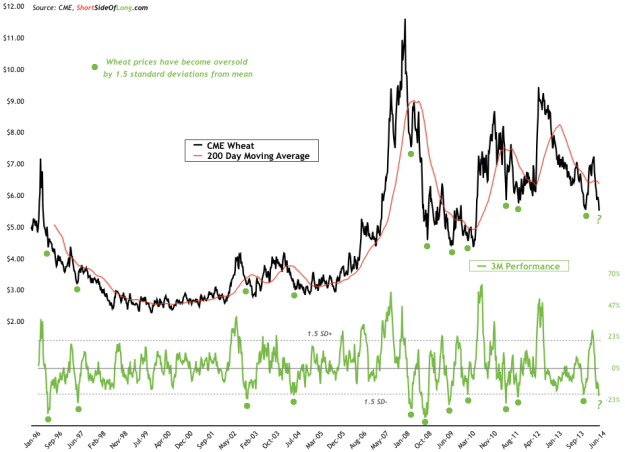
Finally, the two price performance charts below summarise the grains picture quite well. Corn still remains oversold on an annualised basis and is currently experiencing one of the worst 2-year sell offs in its history. On the other hand, Wheat is down hard over the last 3 months, with its rolling quarterly performance at 1.5 standard deviations from the mean.
Chart 4 and 5: Grains have become extremely oversold from the technical perspective
Apart from strong short term harvest results, what has actually changed fundamentally? As far as I can see, not much. If you have done your research, you would already understand that whether we are discussing historically low inventory levels, the plateau in global arable land, serious problems with ageing farmers, an increasing calorie diet in the emerging world, the continual rise of global livestock and so forth, all things point to eventual price inflation for food.
As the panic continues, I am becoming increasingly interested in buying agricultural commodities. Currently I am looking at grains in particular, just as the majority of other traders and funds are dumping them. Hopefully I have enough experience in recognising an opportunity by buying low during a panic and selling high as the fundamentals I've discussed above eventually become priced in.

